Determine the Number of Violent Crimes by Year
To determine
the number of violent crimes by year, create a bar chart.
-
On the SAS tab, click Tasks.
-
In the Tasks window, select Bar Chart Wizard. The Choose Data dialog box appears.
-
To use the sorted data as your input data source, select SAS Data in Excel. In this example, the location is
SASApp:SASDATA.SORTED_CRIME_DATA
                              (SASDATA.SORTED_CRIME_DATA!A1:H21)
. -
For the location of the results, select New worksheet. By default, the name of the new worksheet is Bar Chart Wizard. Rename this worksheet
Bar Chart.Click OK. The Bar Chart Wizard appears. -
In the Verify Data step, verify that SORTED_CRIME_DATA is the input data source, and then click Next.
-
In the Assign variables to roles step, select Violent crime from the Bar height list, and then click Next.
-
In the Specify appearance step, click Axis Labels. The Axis Labels dialog box appears. In the Bar height field, change the label to
Total Number of Offenses.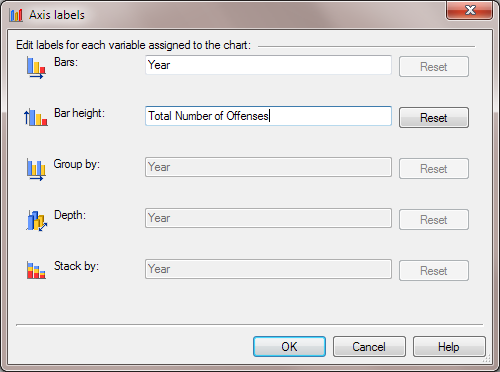 Click OK.
 -
In the Specify appearance step, select the Use reference lines check box, and then click Next.
-
In the Provide a title and footnote step, enter
Number of Violent Crimes
                              by Year
as the title of the graph. Change the footnote toUpdated %TRIM(%QSYSFUNC(DATE(),NLDATE20.)) at %TRIM(%SYSFUNC(TIME(),TIMEAMPM12.)).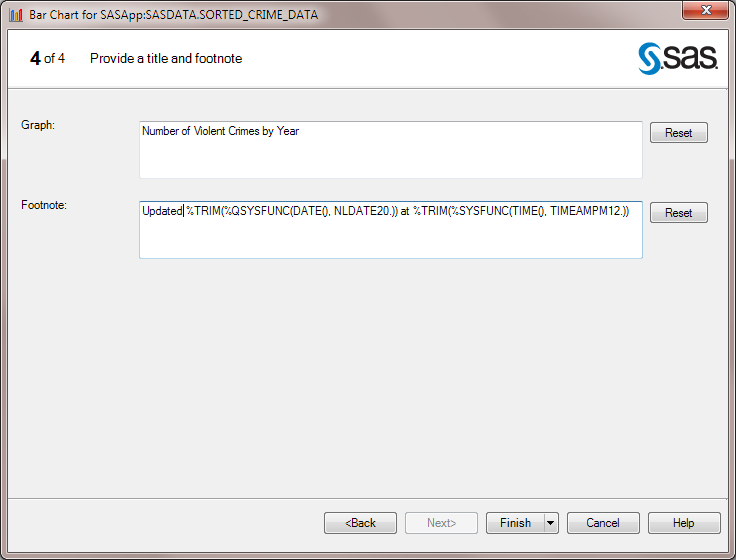 Click Finish.
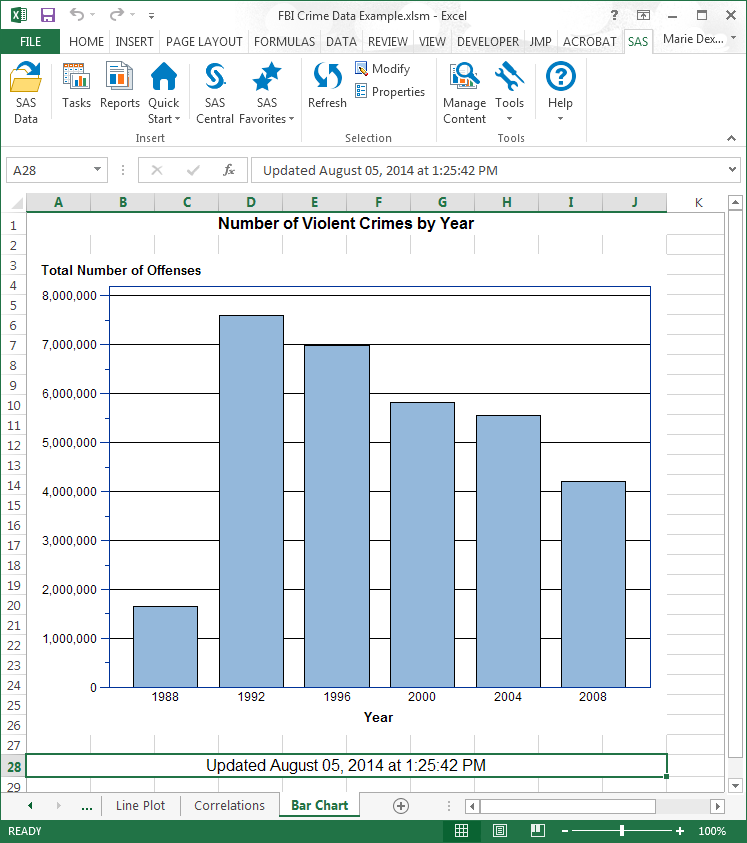
When the Preview dialog
box appears, click Insert All. All of the
results that were generated by the Bar Chart Wizard appear in the
new Bar Chart worksheet.
Copyright © SAS Institute Inc. All Rights Reserved.
Last updated: April 27, 2017