Send Results to a Microsoft PowerPoint Presentation
Your manager wants to present your findings in an upcoming management meeting, so
she asks you to incorporate the line plot and bar chart in a PowerPoint presentation.
Using the SAS add-in, you can send SAS content from an Excel worksheet to a PowerPoint presentation.
To send the line plot
and bar chart from an Excel worksheet to a PowerPoint presentation:
-
On the SAS tab, click Manage Content. The Manage Content window appears.
-
Select the check boxes for Line Plot and Bar Chart Wizard.
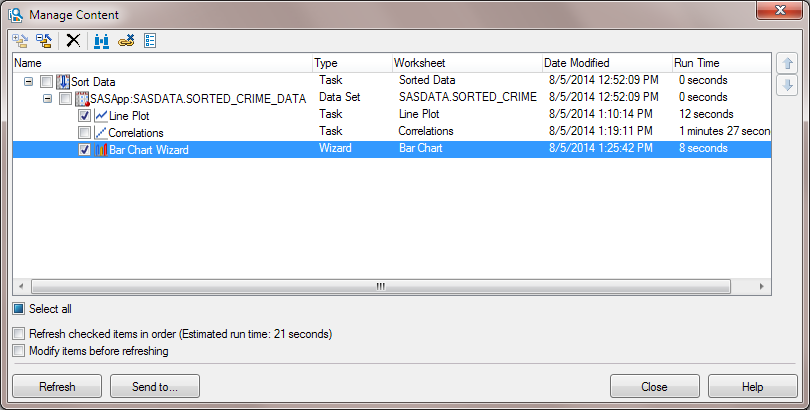 Click Send to. The Send to Microsoft Office dialog box appears.
 -
Select the Send to Microsoft PowerPoint check box. By default, the results are sent to a new PowerPoint presentation and all of the results are included in the same presentation.
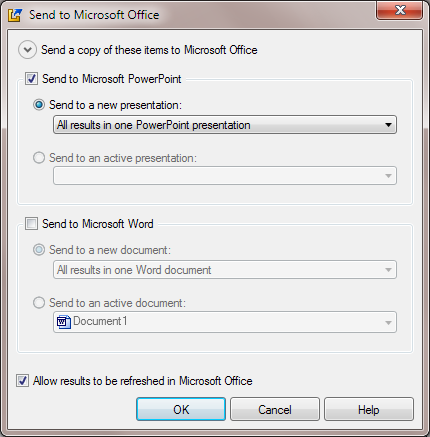 Click OK.
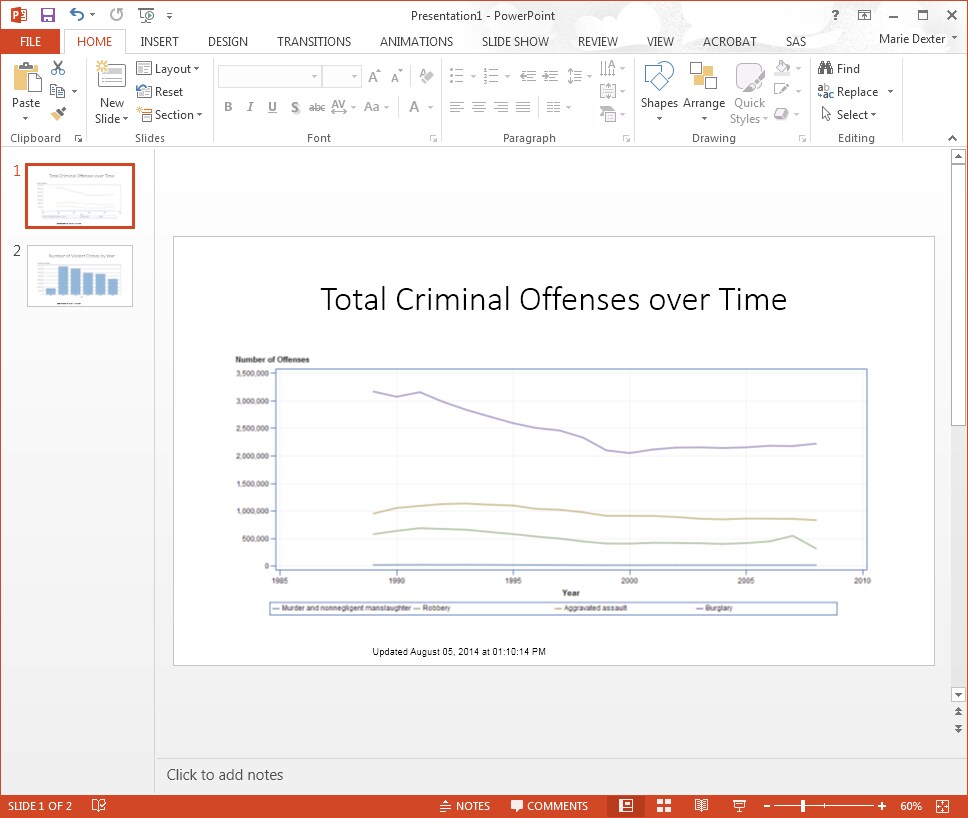
If Microsoft PowerPoint
is not already running, PowerPoint opens and includes the results
in a new presentation. If PowerPoint is already running, the results
are added to a new presentation. Each result appears on a new slide.
Note: If the Preview dialog
box appears, click Insert All.
In Microsoft Excel,
click Close in the Manage Content window
and save your Excel worksheet.
Copyright © SAS Institute Inc. All Rights Reserved.
Last updated: April 27, 2017