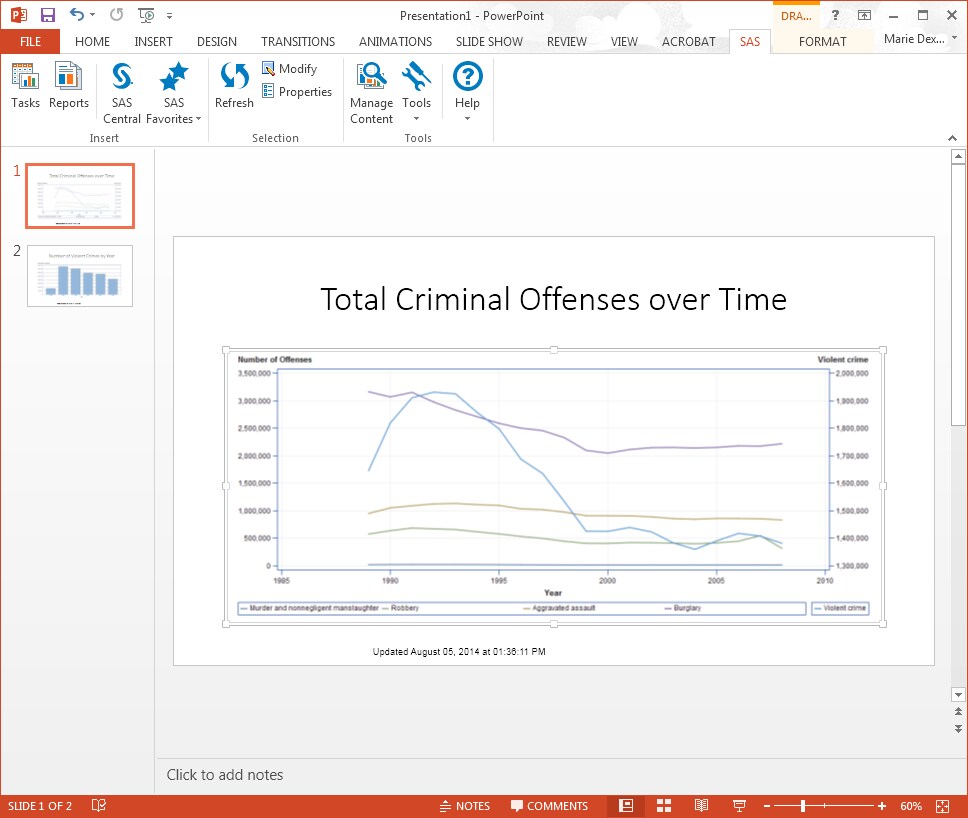
Refresh Results in the PowerPoint Presentation
The data source for the Line Plot
task and the Bar Chart Wizard is saved to a permanent location on
the SAS server. Now, this data source is accessible from both Excel
and PowerPoint. Therefore, you can refresh the results of the Line
Plot task and Bar Chart Wizard in PowerPoint to reflect any changes
that were made to the data. You can also modify these tasks to change
your visual output.
To modify the results
of the Line Plot task in PowerPoint:
-
If ActiveX is the graph format for your results, then you must use the graph settings that are generated by SAS to update the visual output in PowerPoint.To determine the format of your results:
-
In PowerPoint, select the line plot, and on the SAS tab, click Properties. The Line Plot Properties dialog box appears.
-
Click the Appearance tab.
-
If the graph format is ActiveX, select the Use graph settings generated by SAS check box.
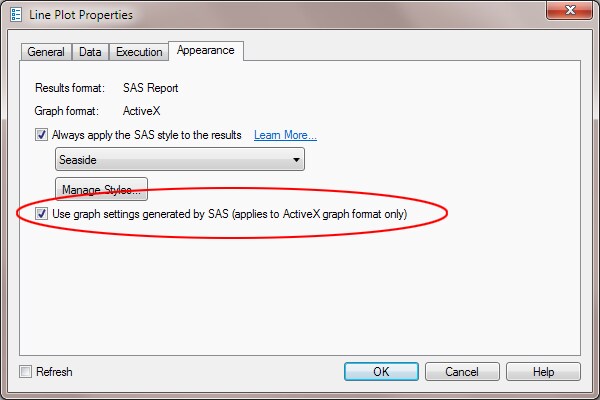 Click OK.
-
-
On the SAS tab, click Modify. The Line Plot task appears. In the selection pane, select Data.
-
In the Data panel, assign the Violent Crime column to the Vertical (Right) role.
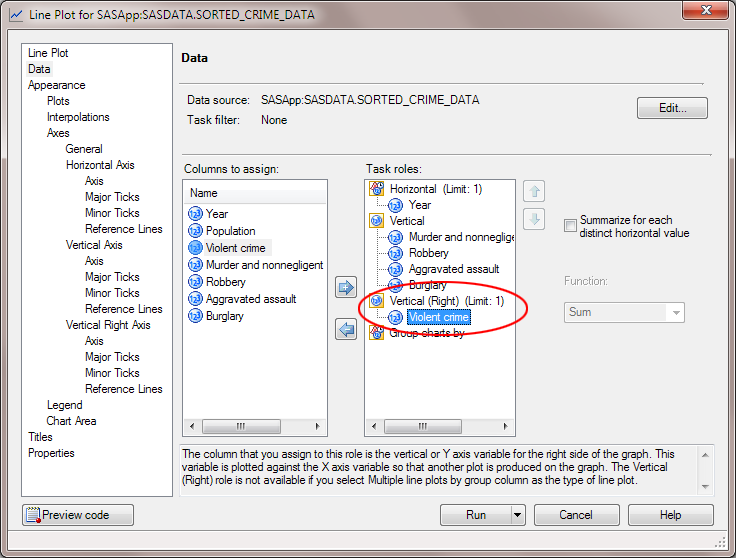 Click Run.
The updated results
appear in the PowerPoint presentation.
Copyright © SAS Institute Inc. All Rights Reserved.
Last updated: April 27, 2017