Determine the Correlation between Population and Violent Crime
To determine whether there is a correlation between population
and the number of violent crimes, use the Correlations task.
-
On the SAS tab, click Tasks.
-
In the Tasks window, select Correlations. The Choose Data dialog box appears.
-
To use the sorted data as your input data source, select SAS Data in Excel. In this example, the location is
SASApp:SASDATA.SORTED_CRIME_DATA
                              (SASDATA.SORTED_CRIME_DATA!A1:H21)
. -
For the location of the results, select New worksheet. By default, the name of the new worksheet is Correlations.Click OK. The Correlations task appears.
-
In the Data panel, assign Population to the Analysis variables role and assign Violent crime to the Correlate with role.
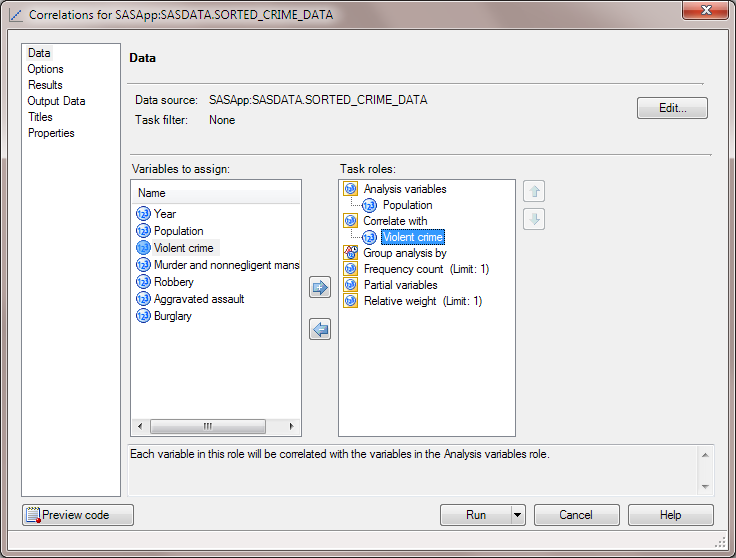 In the selection pane, click Results.
 -
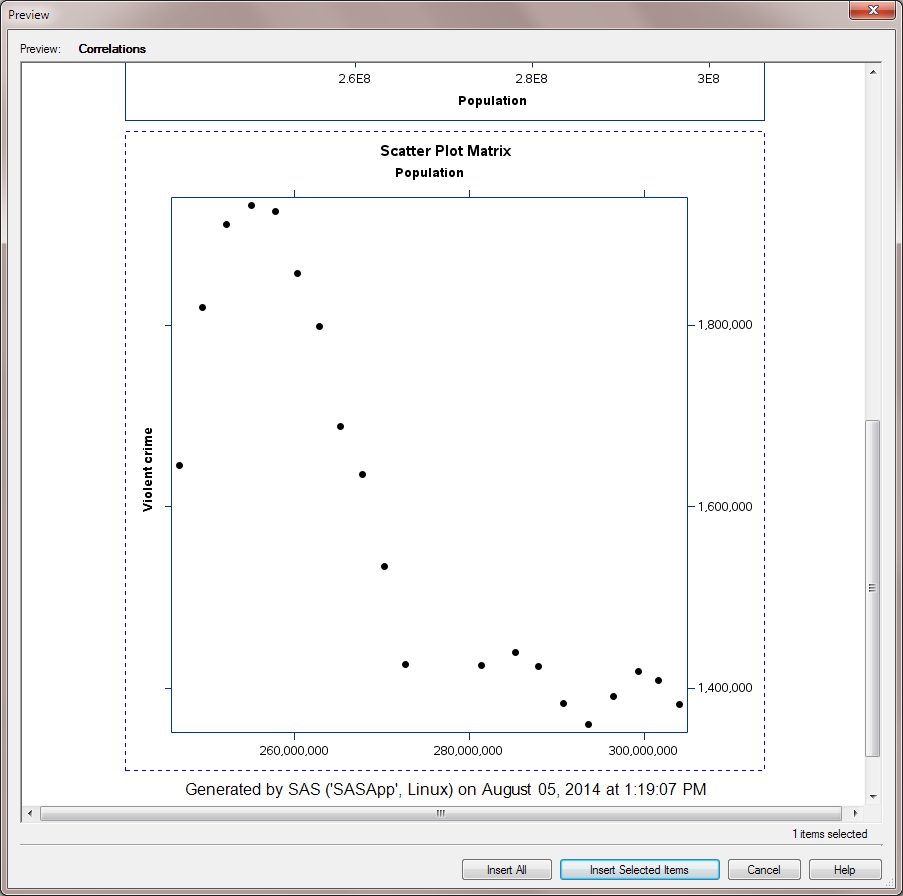
In the Results panel, select the Create a scatter plot for each correlation pair check box.Click Run. The results open in the Preview dialog box.
-
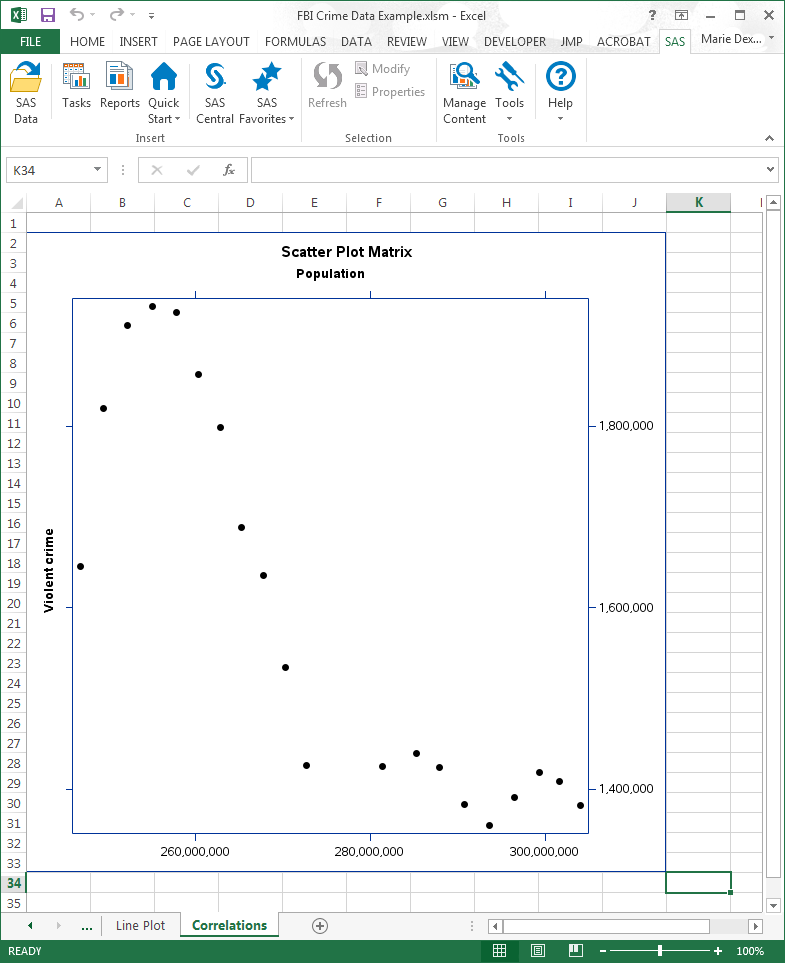
In the Preview dialog box, select the Scatter Plot Matrix and click Insert Selected Items.
The scatter plot matrix
appears in the new Correlations worksheet.
Copyright © SAS Institute Inc. All Rights Reserved.
Last updated: April 27, 2017