|
18MAR04 TS-659 Exporting SAS/GRAPH Output to PDF Files from Release 8.2 and higher The Portable Document Format is a common format for storing text and graphics in a single document. This format supports high-resolutions and maintains the page layout when transmitted, viewed, and printed. The format was developed by Adobe Systems Incorporated and is based upon the PostScript printer language. The program most often used to view PDF files is Adobe's Acrobat Reader. Acrobat Reader can be downloaded for free from Acrobat Reader Download Site. From SAS/GRAPH there are two basic methods for exporting graphs to PDF files: The native device driver method is useful for exporting output from a single procedure to a PDF document. To combine output from multiple procedures in the same document, the PDF Universal printer is recommended. With this method, it is also easier to combine output from both text and graphic procedures in the same document.
It is also possible to create PDF files indirectly by first generating postscript files from SAS and then converting them to the PDF format. This document only discusses methods for creating PDF files directly from SAS. Contents
A. The Native Device Drivers: PDF and PDFC Two SAS/GRAPH device drivers, PDF and PDFC, can be used to create PDF documents from a single graphics procedure. The PDF device driver produces monochrome output while the PDFC device driver generates color output. To export graphics using a graphics device driver, both a FILENAME statement and a GOPTIONS statement should be defined. These statements specify the export format, the storage location, and the name of the file. For example: FILENAME output "myfile.pdf"; Parameters in italics can be modified. In this code, the FILENAME statement assigns the fileref OUTPUT to the location MYFILE.PDF. The syntax necessary for the FILENAME may vary by operating system. The GOPTIONS statement sets the output format to color PDF using DEVICE=PDFC. The GOPTIONS statement also directs the output to the defined file location using the GSFNAME= parameter. It is always a good practice to include the QUIT; statement after the last RUN; statement when exporting SAS/GRAPH output to graphics files. With the PDF and PDFC device drivers, you cannot use the GSFMODE=APPEND option to write multiple graphs to the same file. In order for these files to contain multiple graphs, all the graphs must be written by a single procedure. This can be accomplished using BY-group processing, RUN-group processing, or the GREPLAY procedure. Examples are given below. 1. Fonts It is recommend that a hardware font, one native to the PDF format, be used to generate the output. Text created in a font that is also available to the program viewing the file will be rendered in the correct font. Font substitutions can occur for any font the viewing software does not have available. Acrobat Reader, for instance, only includes the Base 14 postscript fonts with its default installation. The PDF and PDFC device drivers include these same 14 Postscript fonts. The names of these fonts as they are used with these device drivers are listed in the table below.
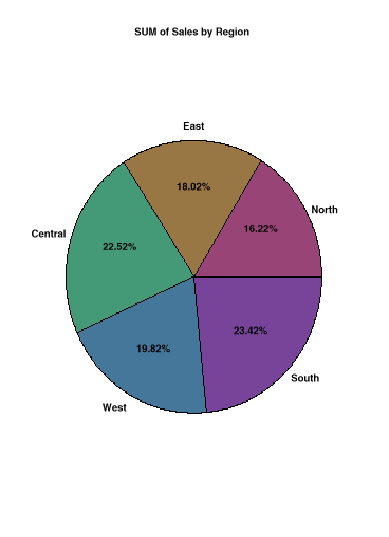
Font names are not case-sensitive but they must be referenced in quotes. Note: If you have an existing program that references these fonts using their hardware names, such as HWPDF001 for the Courier font, these names are still honored in SAS 8.2 and beyond when using the PDF and PDFC device drivers. Listed here are four common methods for producing output using the native PDF and PDFC device drivers. These include: Each method is demonstrated in an example below. The following data is used in all examples in this document. The output from this data may vary in appearance because the summary values are calculated randomly. data sample; output; run; a. Producing one graph from one procedure This program generates a PDF file named PIE.PDF that has one page and one graph in it, a pie chart. The Helvetica-Bold font is used for all the text. goptions reset=all ftext="Helvetica-Bold" dev=pdfc gsfname=output
gsfmode=replace; midpoints="North" "East" "Central" "West" "South"; Note: the different pages in the PDF files generated by the code are represented in this document as separate JPEG screenshots, not the actual pages in the PDF files. Images are not to scale.
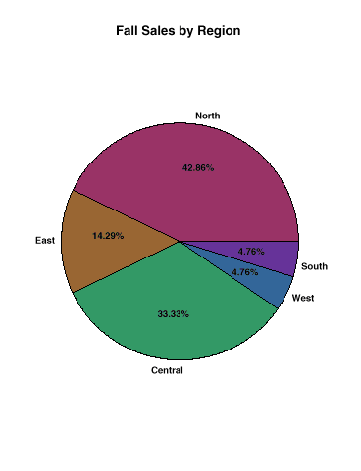
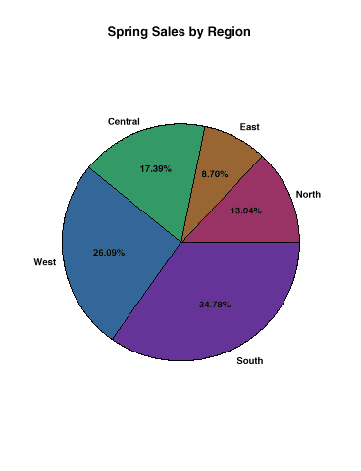
b. Producing multiple graphs from one procedure using a BY statement This program generates a PDF file named BYPIE.PDF that has four pages with one pie chart on each page. The Helvetica-Bold font is used for all text in the document. goptions reset=all ftext="Helvetica-Bold" pattern1 value=solid color=cx994477; pattern2 value=solid color=cx997744; pattern3 value=solid color=cx449977; pattern4 value=solid color=cx447799; pattern5 value=solid color=cx774499; proc sort data=sample; by season; run; title1 height=22pt "#byval1 Sales by Region"; proc gchart data=sample; by season; midpoints="North" "East" "Central" "West" "South";
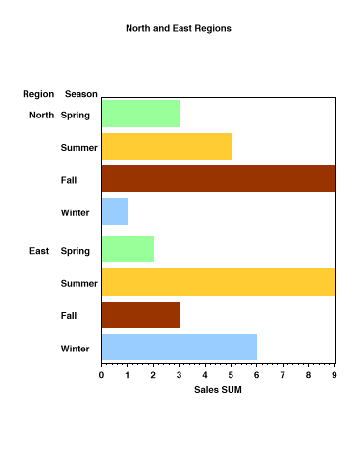
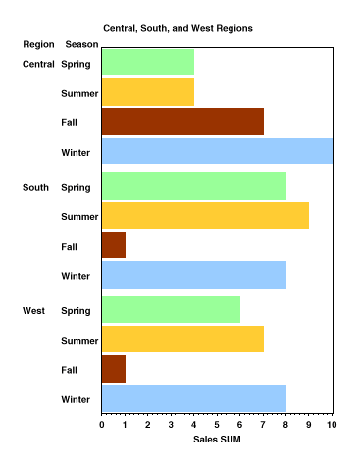
c. Producing multiple graphs from one procedure using RUN-group processing This program generates a PDF file named MULTIRUN.PDF that has two pages with one bar chart on each page. The Helvetica-Bold font is used for all the text in the document. goptions reset=all ftext="Helvetica-Bold" pattern1 value=solid color=cx99ff99; pattern2 value=solid color=cxffcc33; pattern3 value=solid color=cxaa3311; pattern4 value=solid color=cx99ccff; proc gchart data=sample; where Region in("North" "East"); title1 'North and East Regions'; axis1 order=("North" "East"); midpoints="Spring" "Summer" "Fall" "Winter"; where Region in("Central" "West" "South"); title1 'Central, South, and West Regions'; axis1 order=("Central" "South" "West"); midpoints="Spring" "Summer" "Fall" "Winter";
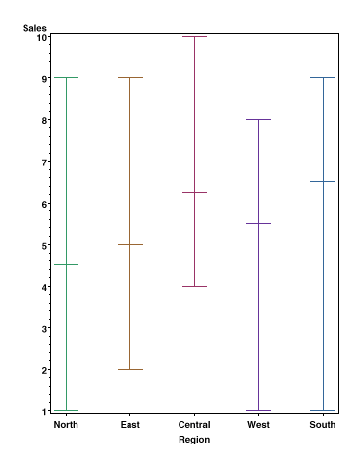
d. Producing multiple graphs from GREPLAY This code stores the graphs from each procedure in a graphics catalog, then replays them in one step to the output file. First the catalog is defined and cleared using the first GREPLAY step. The export format is defined on the GOPTIONS statement, and the NODISPLAY option is specified so the graphs are written only to the catalog, not the output file. On each graphics procedure, the GOUT parameter is used to direct the output to the MYCAT catalog. When all the graphs are created, the DISPLAY option is set so the graphs are written to the output file by the GREPLAY procedure. proc greplay igout=mycat nofs; goptions reset=all ftext="Helvetica-Bold" pattern1 value=solid color=cx994477; pattern2 value=solid color=cx997744; pattern3 value=solid color=cx449977; pattern4 value=solid color=cx447799; pattern5 value=solid color=cx774499; proc gchart data=sample gout=mycat; midpoints="North" "East" "Central" "West" "South"; proc sort data=sample; symbol1 interpol=hilotf width=10 color=cx994477; symbol2 interpol=hilotf width=10 color=cx997744; symbol3 interpol=hilotf width=10 color=cx449977; symbol4 interpol=hilotf width=10 color=cx447799; symbol5 interpol=hilotf width=10 color=cx774499; axis1 offset=(5pct) order=("North" "East" "Central" "West" "South"); proc gplot data=sample gout=mycat; goptions display; proc greplay igout=mycat nofs;
In this example, each graph is written to a separate page of the output. You can also specify a template in the GREPLAY procedure to combine multiple graphs on the same page. To do this, each graph must be properly sized to fit in the template. For example: proc greplay igout=mycat nofs; goptions reset=all ftext="Helvetica-Bold" hby=0 pattern1 value=solid color=cx994477; pattern2 value=solid color=cx997744; pattern3 value=solid color=cx449977; pattern4 value=solid color=cx447799; pattern5 value=solid color=cx774499; proc gchart data=sample gout=mycat; midpoints="North" "East" "Central" "West" "South"; proc sort data=sample; symbol1 interpol=hilotf width=10 color=cx994477; symbol2 interpol=hilotf width=10 color=cx997744; symbol3 interpol=hilotf width=10 color=cx449977; symbol4 interpol=hilotf width=10 color=cx447799; symbol5 interpol=hilotf width=10 color=cx774499; axis1 offset=(5pct) order=("North" "East" "Central" "West" "South"); proc gplot data=sample gout=mycat; goptions display VSIZE=10; proc greplay igout=mycat nofs TC=SASHELP.TEMPLT; treplay 1:gchart 2:gplot; With these modifications, both graphs are written to the same page, with the pie chart above the plot. For SAS 8.2 and beyond, the ODS PDF method is recommended to create this kind of output. B. The Universal Printer: PDF The PDF Universal printer can be useful for storing the output from multiple procedures in the same PDF file. Once the destination is open, all procedure output, including output from text procedures, is directed to the document. By default each table or graph is written to a separate page. You can produce output with the Universal PDF printer by specifying the printer for the PRINTERPATH option on the OPTIONS statement, or as the printer on the ODS PRINTER statement. Specifying the printer on the OPTIONS statement sets the printer as the default printer. You can create PDF files with the printer by using syntax like the following: FILENAME FILEREF 'OUTPUT.PDF'; GOPTIONS DEV=SASPRTC; Parameters in italics can be modified. The device SASPRTC must be specified to direct the graphics output to the default printer. For more control over the placement of objects in the output, you can use the Output Delivery System PRINTER destination instead. You may either specify: "ODS PRINTER PRINTER=PDF" or "ODS PDF"; both statements refer to the same destination. The basic code necessary to generate a PDF file with this method is as follows: RUN;QUIT; Parameters in italics can be modified. The FILE= parameter can point to a predefined file reference or directly to a file as shown. While the ODS destination is open, all procedural output is written to the file FILENAME.PDF. It is important to include the RUN; and QUIT; before the "ODS PDF CLOSE" statement which terminates the destination. Otherwise the output from the last procedure may not be included in the document. Before creating output to the ODS PDF destination, it is recommended that the ODS LISTING destination be closed. On Windows systems, the SASPRTC device driver refers to the system printers when the LISTING destination is opened; closing LISTING prevents the output from going directly to the printer. When the ODS PDF destination is open, the SASPRTC device driver produces graphs in the PDF file using PDF commands, and makes available to the graph all the fonts available in the ODS PDF destination. You could also specify device drivers such as PNG or JAVA when producing graphs in the ODS PDF destination, although these device drivers may not recognize the same font set as the text output in the document. The recommended statements for creating PDF documents with the ODS PDF method are as follows: GOPTIONS DEV=SASPRTC; ODS PDF FILE="filename.pdf"; RUN;QUIT; GOPTIONS RESET=ALL; ODS LISTING; The remainder of this document focuses on using the ODS destination with the PDF Universal printer to create PDF output files. The fonts available with the ODS PDF destination are listed in the SAS Registry under the [CORE\PRINTING\PRINTERS\PSL\FONT FAMILIES] key. Remember that these fonts are not included in the PDF file, so only the fonts installed with the Reader will be rendered correctly. Therefore, unless you are certain a non-standard font will be available on the recipient's system, it is recommended that the Base 14 fonts, those included with the default installation of Reader, be used. For the PDF Universal printer, these fonts are referenced as follows:
Font names must be enclosed in quotes but they are not case-sensitive. The parameters listed after the slashes may come in any order. Notice that these names vary from the names used with the PDF and PDFC device drivers. 
Using the FreeType library, SAS 9.1 can embed TrueType fonts in PDF files created with the PDF Universal printer. When a font is embedded, font information is carried in the document, and the viewer does not require that the font be installed on the system in order for the text to display properly. Embedding fonts can prevent font substitutions, and ensure that the document always has the same look. The new FONTREG procedure is used to add information about font files on the system to the SAS Registry. This step must be performed before the ODS PDF destination can embed these fonts. Information about two TrueType fonts, SAS Monospace and SAS Monospace/bold, is already added for you. To make other fonts available, follow the steps discussed in the paper, Using TrueType fonts with Universal Printing in SAS 9.1. Three levels of font embedding are supported: none, partial, and full. The default level for the PDF Universal Printer is partial. You can change these settings using the instructions in Changing the Embedding Value below. 2. ODS PDF Parameters and Options Using the ODS PDF method allows you to easily create PDF files containing multiple graphs and table. It also gives you control over other aspects of the PDF document, including document information, the table of contents (aka "bookmarks"), and greater control over the page layout. The parameters that can be specified are as follows: PAPERSIZE=value LEFTMARGIN=value RIGHTMARGIN=value TOPMARGIN=value BOTTOMMARGIN=value; AUTHOR="value" KEYWORDS="value" SUBJECT="value" TITLE="value" STARTPAGE=value STYLE=value; ODS REGION X=value Y=value HEIGHT=value WIDTH=value; ODS PROCLABEL="value"; RUN;QUIT; ODS PDF CLOSE; Statements in italics can be modified; only bold statements are required. The OPTIONS statement must precede the first ODS PDF statement in order for the settings to take effect in the document. The entire document will be created with these same settings. Each parameter and option is described below. a. Parameters that write document information TThese parameters provide general information about the document. They should be specified on the first ODS PDF statement that designates the FILE that is created. The values of these parameters can be viewed in the "General" section of the "Document Info" dialog when the document is viewed in Acrobat Reader.
b. Parameters that control the bookmarks Each procedure that writes output to the PDF file creates bookmarks including headings that describe the procedure and subheadings that describe the graphs or tables created by the procedure. These bookmarks can be used to easily navigate to different sections of the document.
c. Parameters and options that affect page layout

New to SAS 9 is the ability to compress the files generated by ODS PDF. The valid values for this parameter range from 0 to 9 where 0 means no compression and 9 means maximum compression. The default value is 6. Be aware that setting compression to high levels, such as 8 or 9, may greatly increase the processing time required to create the output. Four examples are given below for generating graphics to the ODS PDF destination. The last example shows how to create a PDF printer to fully embed all fonts, or embed no fonts. a.
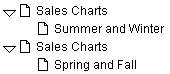
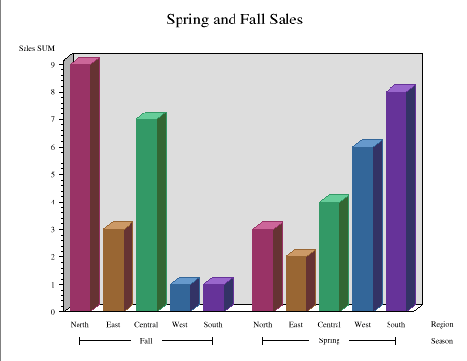
Multi-page PDF file using multiple procedures Data for the first four examples is created here. a. Producing a multi-page PDF file using multiple procedures This code generates a two-page, landscape-oriented PDF file named VBAR.PDF. Each page contains one vertical bar chart. The Times font is used for all the text in the output. The following bookmarks are produced in the file:
Each bookmark would navigate to the corresponding page in the file.
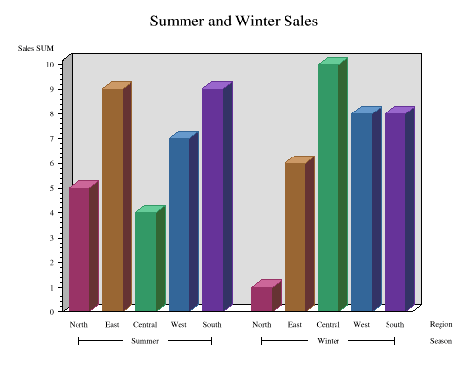
goptions reset=all device=sasprtc ftext="Times"; pattern1 value=solid color=cx994477; pattern2 value=solid color=cx997744; pattern3 value=solid color=cx449977; pattern4 value=solid color=cx447799; pattern5 value=solid color=cx774499; ods listing close; ods pdf file='vbar.pdf'; ods proclabel="Sales Charts"; proc gchart data=sample; where season in('Summer' 'Winter'); description="Summer and Winter" midpoints="North" "East" "Central" "West" "South"; title1 'Spring and Fall Sales'; proc gchart data=sample; where season in('Spring' 'Fall'); description="Spring and Fall" midpoints="North" "East" "Central" "West" "South"; ods pdf close; goptions reset=all; ods listing;
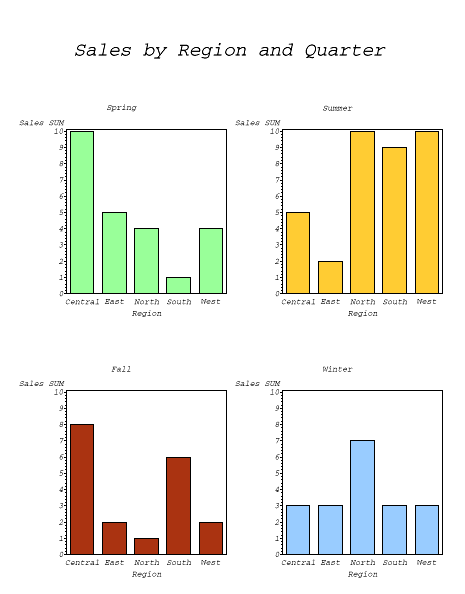
b. Producing a one-page PDF file containing multiple graphs from multiple procedures using STARTPAGE This code combines four graphs in one PDF file named FOURVBARS.PDF. The STARTPAGE=NEVER parameter keeps all the output on one page. Each graph is positioned on the page using the HORIGIN and VORIGIN parameters on the GOPTIONS statement. The size of each graph is set using the HSIZE and VSIZE parameters on the GOPTIONS statement. The first graph, GSLIDE, creates the common title over all the graphs. The LSPACE parameter on the TITLE statement inserts a line space above the title. The Courier/oblique font is used for all the text in the output.
goptions reset=all dev=sasprtc ftext="Courier/oblique"; ods listing close; ods pdf file="FourVbars.pdf" startpage=never; proc gslide; goptions horigin=0 vorigin=5 hsize=4 vsize=4; axis1 order=(0 to 10); title1 'Spring'; pattern1 value=solid color=cx99ff99; proc gchart data=sample; where Season='Spring'; goptions horigin=4 vorigin=5; title1 'Summer'; pattern1 value=solid color=cxffcc33; proc gchart data=sample; where Season='Summer'; goptions horigin=0 vorigin=0; title1 'Fall'; pattern1 value=solid color=cxaa3311; proc gchart data=sample; where Season='Fall'; goptions horigin=4 vorigin=0; title1 'Winter'; pattern1 value=solid color=cx99ccff; proc gchart data=sample; where Season='Winter'; goptions reset=all; ods listing;
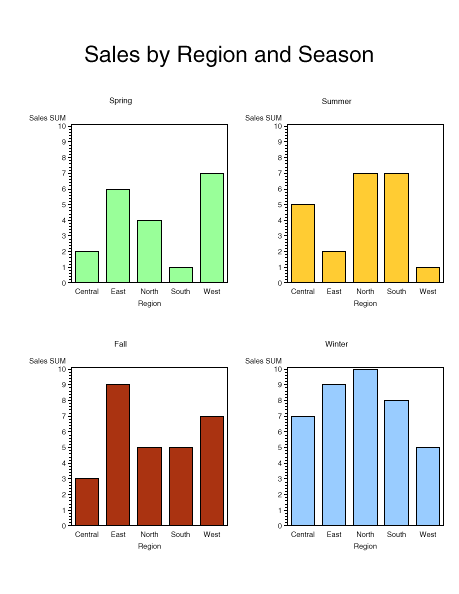
c. Producing a one-page PDF file containing multiple graphs from multiple procedures using ODS LAYOUT
This code combines four graphs in one PDF file named LAYOUT1.PDF. Each graph is positioned on the page using the X and Y values on the ODS REGION statement. The HEIGHT and WIDTH parameters define the size of each region. The size of each graph is set automatically to fit within the region. The first graph, the GSLIDE, creates the common title over all the graphs. The LSPACE parameter on the TITLE statement inserts a space above the title. The Helvetica font is used for all the text in the output. Note: Remember that the values for X and HORIGIN work similarly: they both increase from left to right. The values for Y and VORIGIN are opposites.
goptions reset=all dev=sasprtc ftext="Helvetica"; ods listing close; ods pdf file="LAYOUT1.pdf"; ods layout start; ods region x=0 in y=0 in height=10.5 in width=8 in; proc gslide; title1 'Sales by Region and Season' lspace=.5in; run;quit; pattern1 value=solid color=cx99ff99; proc gchart data=sample; where Season='Spring'; pattern1 value=solid color=cxffcc33; proc gchart data=sample; where Season='Summer'; pattern1 value=solid color=cxaa3311; proc gchart data=sample; where Season='Fall'; pattern1 value=solid color=cx99ccff; proc gchart data=sample; where Season='Winter'; ods pdf close; goptions reset=all; ods listing;
d. Producing a one-page PDF file containing multiple graphs and tables using ODS LAYOUT
This code combines two graphs and two tables on a document named LAYOUT2.PDF. Each output is positioned on the page using the X and Y values on the ODS REGION statement. The HEIGHT and WIDTH parameters define the size of each region. The size of each graph is set automatically to fit within the region. The first graph, the GSLIDE, creates the common title over all the graphs. The LSPACE parameter on the TITLE statement inserts a line space above the title. The Helvetica font is used for all the text in the graph. options orientation=portrait; title1 'Sales by Region and Season' lspace=.5in; run;quit; pattern1 value=solid color=cx33aacc; proc gchart data=sample; midpoints="North" "East" "Central" "West" "South"; define region / group; proc gchart data=sample; midpoints="Spring" "Summer" "Fall" "Winter"; define season / group; ods pdf close; ods listing;
e. Changing the Font Embedding Level The level of font embedding for a given printer is set in the SAS Registry under the "Font Embedding Level" key. In the SAS Registry, the "Font Embedding Level" key can have one of the following values:
All TrueType fonts used in the document are embedded according to this setting. Embedding of other font types is not yet supported in this release. The Universal PDF printer has a value of 1 for this key, so it supports partial embedding by default. You can create documents that fully embed or do not embed TrueType fonts by defining additional printers with the REGISTRY procedure. One easy method for creating a new printer from an existing printer is to export the keys for an existing printer to a file, modify the file, and re-import it. The steps are as follows: 1) Export the printer data to a file With this code, the keys and values that define the Universal PDF printer are written to the file, PDFPARTIAL.SASXREG: usesashelp startat='core\printing\printers\pdf'; run; 2) Modify the keys and attributes in the file The file can be modified with a text editor. At minimum, the printer name and Font Embedding Level value should be changed. The following text shows the modified contents of the exported file. The printer name has been changed from PDF to PDFFULLEMB in all the key names (key names are enclosed in [ ] square brackets). The description was changed, and the Font Embedding Level is changed to 2, fully embed. The modified lines are italicized. [CORE] [CORE\PRINTING] [CORE\PRINTING\PRINTERS] [CORE\PRINTING\PRINTERS\PDFFULLEMB] "Description"="Portable Document Format Version 1.3 (Full Font Embedding)" "Prototype"="PDF Version 1.3 (Partial Font Embedding)" [CORE\PRINTING\PRINTERS\PDFFULLEMB\ADVANCED] "Baseline Rotation"=int:1 "Buffer Size"=int:255 "Color Depth"=int:24 "Color Space"="RGB" "Compression Level"=int:6 "Compression Method"=int:3 "Conceal"=int:0 "Copy"=int:1 "Driver"="SASPDPDF" "Extension"="pdf" "Font Embedding Level"=int:2 "FONT FAMILIES"=LINK:"\\CORE\\PRINTING\\PSL\\FONT FAMILIES" "Font Rendering"="PostScript" "Glyph Rotation"=int:0 "Language"="Portable Document Format Version 1.3" "Language Level"=int:1 "Messages"=int:1 "Previewer"=int:1 "Version"=int:3 "Visual Type"="Direct Color" [CORE\PRINTING\PRINTERS\PDFFULLEMB\DEFAULT SETTINGS] "Font Character Set"="Western" "Font Size"=double:12 "Font Style"="Regular" "Font Typeface"="Courier" "Font Weight"="Normal" "Margin Bottom"=double:0.25 "Margin Left"=double:0.25 "Margin Right"=double:0.25 "Margin Top"=double:0.25 "Margin Units"="IN" "Paper Destination"="" "Paper Size"="" "Paper Source"="" "Paper Type"="" "Resolution"="300 DPI" [CORE\PRINTING\PRINTERS\PDFFULLEMB\PRINTER SETUP] "FONTS"=LINK:"\\CORE\\PRINTING\\PSL\\FONTS" "PAPER SIZES"=LINK:"\\CORE\\PRINTING\\PSL\\PAPER SIZES" [CORE\PRINTING\PRINTERS\PDFFULLEMB\PRINTER SETUP\ORIENTATION] "Landscape"=int:270 "Portrait"=int:0 "ReverseLandscape"=int:90 "ReversePortrait"=int:180 [CORE\PRINTING\PRINTERS\PDFFULLEMB\PRINTER SETUP\OUTPUT] "Destination"="sasprt.pdf" "Device Type"="DISK" "Host Options"="" "Protocol"="Default" "Translate Table"="None" [CORE\PRINTING\PRINTERS\PDFFULLEMB\PRINTER SETUP\RESOLUTION] "300 DPI"=LINK:"\\CORE\\PRINTING\\PSL\\RESOLUTION\\300 DPI" "Units"="in" You could make similar changes to define a printer that does not embed any font information. Below are the lines that would need to be modified. "Description"="Portable Document Format Version 1.3 (No Font Embedding)" [CORE\PRINTING\PRINTERS\PDFNOEMB\ADVANCED] "Font Embedding Level"=int:0 [CORE\PRINTING\PRINTERS\PDFNOEMB\DEFAULT SETTINGS] [CORE\PRINTING\PRINTERS\PDFNOEMB\PRINTER SETUP] [CORE\PRINTING\PRINTERS\PDFNOEMB\PRINTER SETUP\ORIENTATION] [CORE\PRINTING\PRINTERS\PDFNOEMB\PRINTER SETUP\OUTPUT] [CORE\PRINTING\PRINTERS\PDFNOEMB\PRINTER SETUP\RESOLUTION] A file created with these changes can be used to define a printer named PDFNOEMB that does not embed any font information. 3) Import printer data The text files should be saved with the .SASXREG extension, then imported to the SAS Registry using the REGISTRY procedure. This code assumes the information for the two printers described above were saved to text files named PDFFULL.SASXREG and PDFNO.SASXREG. run; run; 4) Using the new printer Reference the printer on the ODS PRINTER statement using the PRINTER= option. This example will fully embed the SAS Monospace font in the file TEST.PDF. ods listing close; ods printer sas printer=pdffullemb file='test.pdf'; ods listing; goptions reset=all; C. Resources |
|||||||||||||||||||||||||||||||||||||||||||||||||||||||||||||||||||||||||||||||||||||||||