SAS Products
SAS Risk Dimensions - Inserting Rare Events into a Simulation
Specify the Analysis and Create the Project
Overview
When you perform risk analysis, two common assessment techniques are simulation and stress scenarios. Simulations are often based on behavior that you have observed in the past. A shortcoming to that approach is that simulations can fail to capture extreme events. These are events that might never have occurred, or might have occurred with such infrequency that they are not realized in simulation. Stress scenarios, on the other hand, look exclusively at extreme events. They predict the likelihood that such an event will occur.
SAS Risk Dimensions enables you to incorporate stress scenarios into a simulation. You can define a rare event and assign it a probability of occurrence. As a simulation model runs, it randomly triggers the rare event. For example, you can define a rare event such as the .005% chance that a stock price will decrease $10 in one day. On average, you should see that the rare event occurs in the simulation with a frequency equal to the probability that you specify .
You can also assign a conditional probability to the rare event that assigns the likelihood of occurrence given that the event occurred in a previous horizon. This captures the notion of increased risk following an extreme event.
Objective
In this example you simulate the value of a portfolio containing two shares of stock (see "Assessing Market Risk" for more information). You generate 50,000 market states and calculate the portfolio's value and profit/loss at each market state. You also define two stress scenarios, a BankCompany shock in which BNK stock drops $0.50/share and a TechCompany shock in which TEC stock drops 20%.
You assign a probability and conditional probability to the stress scenarios by creating a rare event probability data set. When the simulation is run, the stress scenarios are randomly triggered according to the probabilities you specify in that data set.
When the project has run, look at the output data set named RareEvents to see when the stress scenarios were triggered during simulation.
Set Up Your Environment
First, specify the library for analysis and the name of the SAS Risk Dimensions environment. Use the directory C:\users\sasdemo\RD_Examples. You can assign the library to any path as long as you have Write access to that directory.
libname RDExamp "C:\users\sasdemo\RD_Examples";%let test_env = rareevent;
In this code, you use the SAS Macro Language Facility to create the macro variable test_env. You assign the value rareevent to the variable test_env. Using macro variables in this way gives you the flexibility to change the physical location of the target library and environment name in just two lines of code.
Next, create a new SAS Risk Dimensions environment assigned the name rareevent in the library RDExamp.
env save;
Register Your Portfolio Data
The portfolio has two instruments, 1M shares of TechCompany stock and 1M shares of BankCompany stock.
datalines;
|
TechCompany instid1 1000000 BankCompany instid2 1000000 |
Register Market Data
The current value of TechCompany stock is $15/share and BankCompany stock is $3/share. The following code inputs the market data and the covariance matrix for the risk factors.
BNK=3;
_type_ = "COV";
input _name_ $ TEC BNK;
datalines;
|
TEC .0004 .00006 BNK .00006 .0001 |
Now, add the rare events. Define the stress scenarios using the SCENARIO statement, and then assign them probabilities and conditional probabilities using the rare events probability data set.
scenario BNKStress type=abs
input eventname $ uncond_prob cond_prob;
datalines;
|
BNKStress .20 .25 TECStress .05 .10 |
The value of the portfolio depends on two risk factors, TEC and BNK, the stock prices of TechCompany and BankCompany respectively. Declare them, and then register the market data, the covariance matrix, and the rare events data set with the MARKETDATA statement. For the rare events data set, specify option values for the random seed and time interval associated with the probability.
declare riskfactors=(TEC num var, BNK num var);
marketdata Market file=RDExamp.mktdata type=current;
marketdata Cov file=RDExamp.covdata type=covariance;
marketdata RareEvents file = RDExamp.RareEventMap
Define Valuation Methods
Create pricing methods using the COMPILE procedure for use in this environment. The COMPILE procedure is similar to and supports the functionality and syntax of the FCMP procedure. For more information, see the SAS Risk Dimensions and SAS High-Performance Risk: Procedures Guide.
With the RISK procedure, specify which pricing methods to use for each of the instrument types through assignment in the INSTRUMENT statement. Also specify the instrument variable needed for pricing; insttype and instid do not need to be specified as they are included by default.
method Bank_Price kind=price;
Specify an Analysis and Create the Project
Set up a project to simulate values for the portfolio based on the current market data, the covariance data, and the rare events data set. In the SIMULATION statement, reference the covariance data set and the rare events data set that you created and registered previously. Add the option RAREEVENTS to the PROJECT statement in order to output the rare events output data set.
read sources=InstDataSource out=Portfolio;
crossclass RareEventCC (Insttype);
simulation Covariance method=covariance
outvars=(pl)
horizon = (1 2 3 4 5)
data= (Cov RareEvents)
;
portfolio=Portfolio
crossclass=RareEventCC
data=( Market )
;
Run the Project
Run the project, putting output files in the RareEvt subdirectory of the environment directory.
setoptions keeplib;
runproject Project
options=(outall rareevents)
;
View Results
The output data set RareEvents shows you when the rare events were triggered. This is a screenshot of the RareEvents data set.
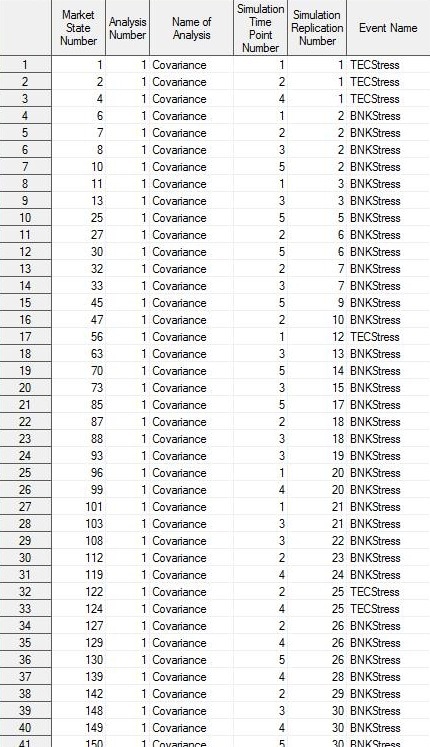
Parsing this data set, you can create a data set that can be input to the FREQ procedure. With the FREQ procedure you can verify that the rare events occurred with the frequency specified in the rare events probability data set.
The following SAS code produces the subsequent frequency tables:
simulationreplication = i;
do j = 1 to 5;
simulationtime = j;
output;
end;
end;
drop i j;
set rareevt.TECStress;
length eventname $20.;
if _n_ eq 1 then do;
declare hash h(dataset:'rareevt.rareevents');
h.defineData('eventname');
h.defineDone();
if h.find() eq 0 then output;
else do;
eventname = "Underlying Model";
output;
end;
run;
out = rareevt.TECStressT
prefix = SimulationTime;
by simulationreplication;
id simulationtime;
var eventname;
run;
tables SimulationTime1/NoFreq NoCum;
tables SimulationTime1*SimulationTime2
SimulationTime3*SimulationTime4
SimulationTime4*SimulationTime5/NoFreq Nopercent NoCol ;
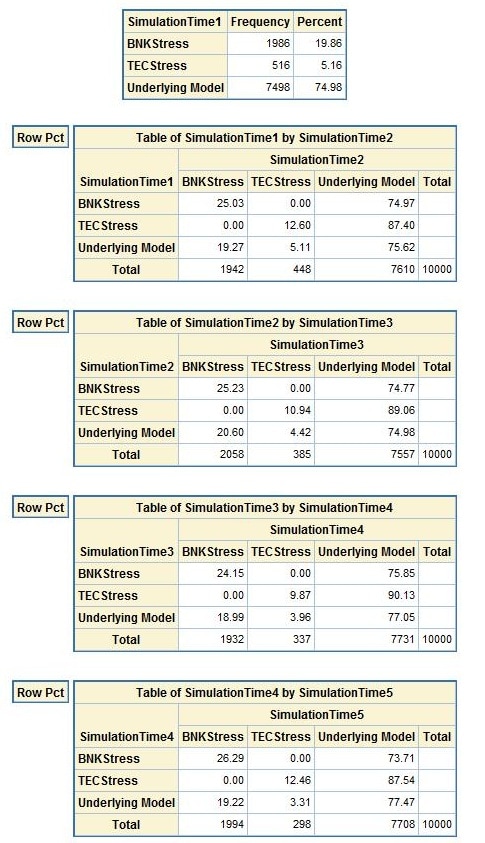
The results displayed in these frequency tables show that the rare events occurred as expected. If BNKStress was triggered in a given horizon, it occurred again in the next horizon with a probability of around 25%.