SAS Products
SAS Risk Dimensions - Assessing Market Risk
Specify the Analysis and Create the Project
Objective
In the following exercise, you create a portfolio that consists of shares of stock in two companies. You run a simulation of stock prices based on the known variances and covariances of the stock price returns. Then you calculate risk statistics based on the simulated portfolio values.
Set Up Your Environment
First, specify the library for analysis and the name of the SAS Risk Dimensions environment. Use the directory C:\users\sasdemo\RD_Examples. You can assign the libref to any path as long as you have Write access to that directory.
%let test_env = marketrisk;
Next, create a new SAS Risk Dimensions environment named marketrisk in the library RDExamp.
env save;
Register Your Portfolio Data
Next, describe the assets in your portfolio. The following code creates a data set called instdata that stores information about the two instruments in your portfolio. There are three instrument variables: InstType, InstID, and Holding.
|
data RDExamp.instdata;
input insttype $12. instid $8. holding; datalines; |
|
TechCompany instid1 1000000 BankCompany instid2 1000000 |
| ; |
The following code registers the instrument data in the environment.
instdata Instruments file=RDExamp.instdata format=simple;
env save;
Register Market Data
There are two risk factors, TEC and BNK, which represent the prices of TechCompany stock and BankCompany stock. Define the current risk factor values and covariances. Declare the risk factors and register the market data in the environment.
BNK=30;
|
data RDExamp.covdata;
length _name_ _type_ $8;
_type_ = "COV"; input _name_ $ TEC BNK; datalines; |
|
TEC .0004 .00006 BNK .00006 .0001 |
| ; |
declare riskfactors=(TEC num var, BNK num var);
marketdata Market file=RDExamp.mktdata type=current;
marketdata Cov file=RDExamp.covdata type=covariance; env save;
Define Valuation Methods
Create pricing methods using the COMPILE procedure for use in this environment. The COMPILE procedure is similar to and supports the functionality and syntax of the FCMP procedure. For more information, see the SAS Risk Dimensions and SAS High-Performance Risk: Procedures Guide.
Tell the RISK procedure which pricing methods to use for each of the instrument types through assignment in the INSTRUMENT statement. Also specify the instrument variables needed for pricing; insttype and instid do not need to be specified as they are included by default.
_value_ = TEC;
endmethod;
method Bank_Price kind=price;
_value_ = BNK;
endmethod;
instrument TechCompany methods=(Price Tech_Price) variables = (holding);
instrument BankCompany methods=(Price Bank_Price) variables = (holding);
env save;
Specify the Analysis and Create the Project
Set up an analysis project to simulate values for your portfolio based on the current market data and the covariance data. The following code creates a portfolio file from the instrument data set and identifies the cross classifications for portfolio aggregation. Then it creates a covariance simulation analysis. Lastly, it creates the project, specifying the portfolio and assigning the covariance simulation analysis.
sources InstDataSource (Instruments);
read sources=InstDataSource out=Portfolio;
crossclass MarketRiskCC (Insttype);
simulation Covariance method=covariance
outvars=(pl)
data=Cov;
portfolio=Portfolio
crossclass=MarketRiskCC
data=( Market );
Run the Project
Run the project, putting output files in the marketout subdirectory of the environment directory.
runproject Project
options=(outall) ;
View Results
Next, analyze your results. You can perform analysis on SAS data sets output from the project.
The following figure shows the SimStat data set. It contains the simulation statistics for the portfolio such as Value at Risk, Expected Shortfall, and Mark to Market.

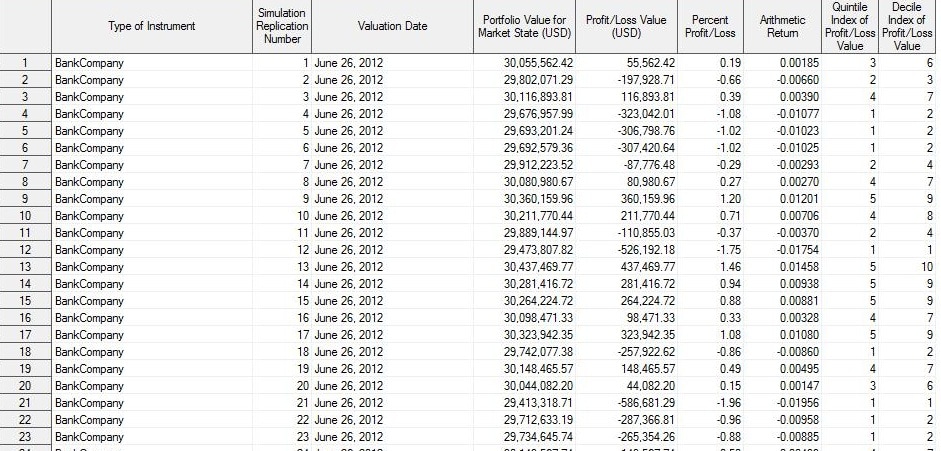
The following figure shows the SimValue data set. Here you can inspect observations for each simulation of each cross classification.
