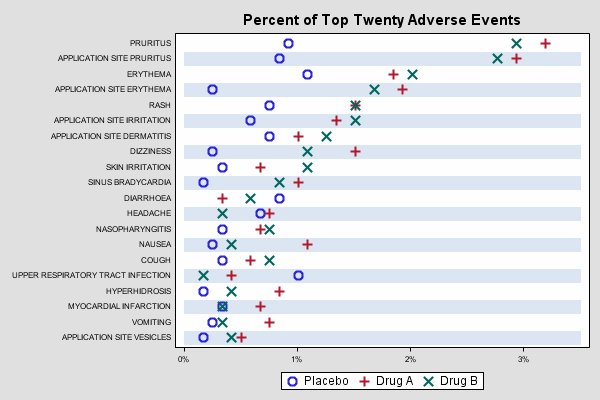
Sample 39173 - Bar chart with scatter plot overlay[ View Code ]
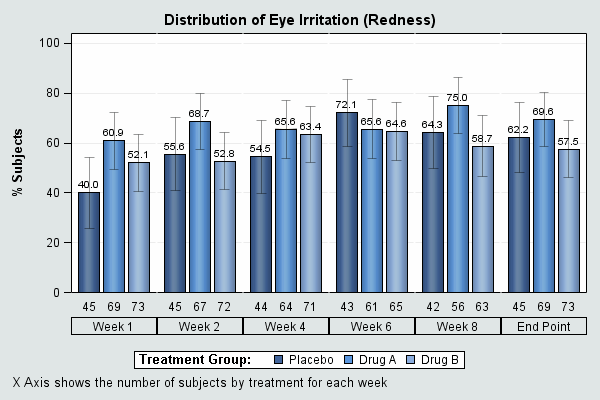
Sample 39166 - Grouped bar chart with error bars[ View Code ]
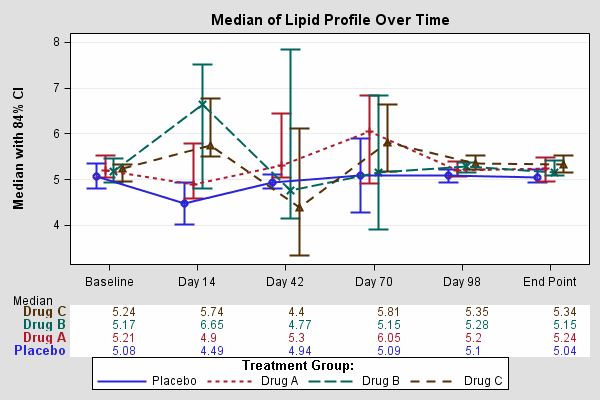
Sample 39132 - Overlay graph and block plot across treatment groups[ View Code ]
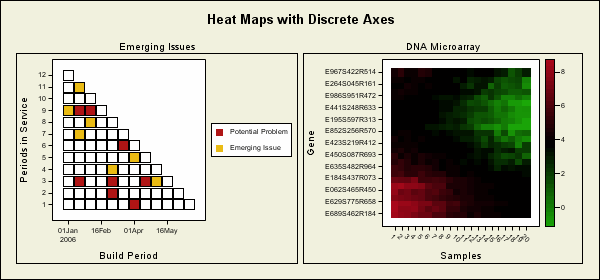
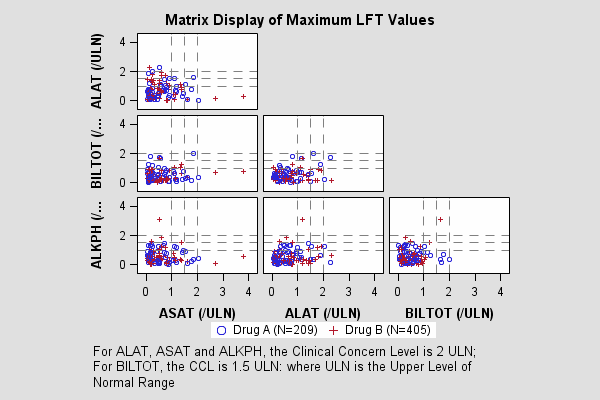
Sample 39100 - Matrix display of maximum LFT values[ View Code ]
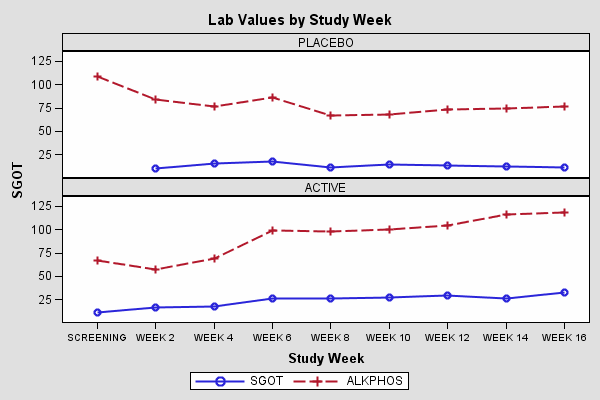
Sample 39099 - Lab values by study week[ View Code ]
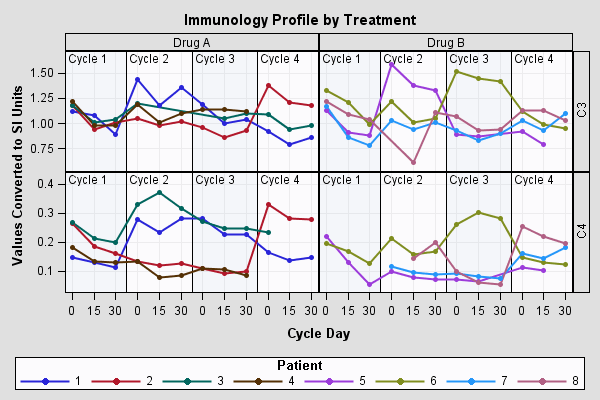
Sample 39092 - Patient profile by treatment[ View Code ]
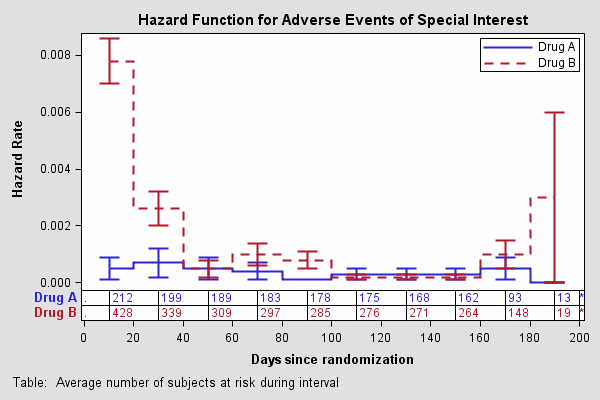
Sample 39090 - Step plot with error bars[ View Code ]
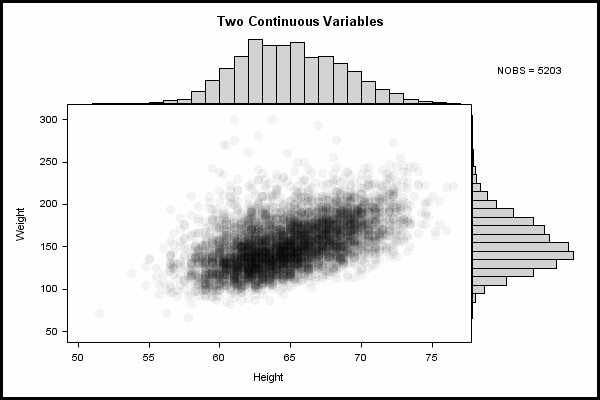
Sample 35172 - Distribution plot[ View Code ]