Click on the About tab within each sample for product and release requirements.
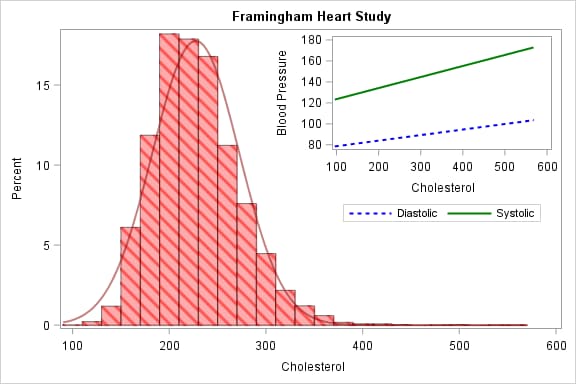
Sample 59322 - How to nest a graph within a graph[ View Code ]
Sample 56938 - Display special symbols as axis values using PROC FORMAT with the Graph Template Language (GTL) [ View Code ]
Sample 54314 - Customize your symbols with the SYMBOLCHAR statement in the Graph Template Language (GTL)[ View Code ]
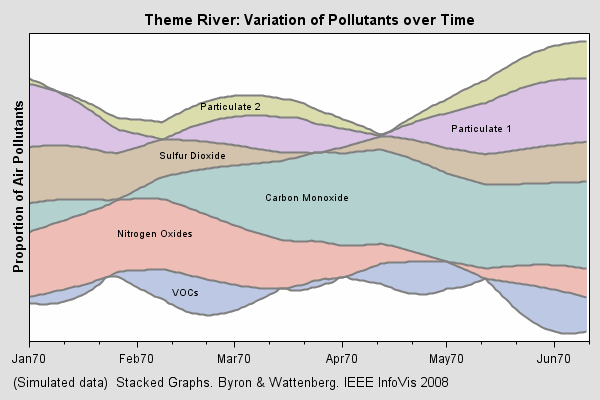
Sample 52962 - Create a spaghetti plot with the Graph Template Language (GTL)[ View Code ]
Sample 49700 - Define a dynamic template definition with the Graph Template Language (GTL)[ View Code ]
Sample 49698 - Define a discrete attribute map with the Graph Template Language (GTL)[ View Code ]
Sample 49697 - Add a table beneath a graph with the Graph Template Language (GTL)[ View Code ]
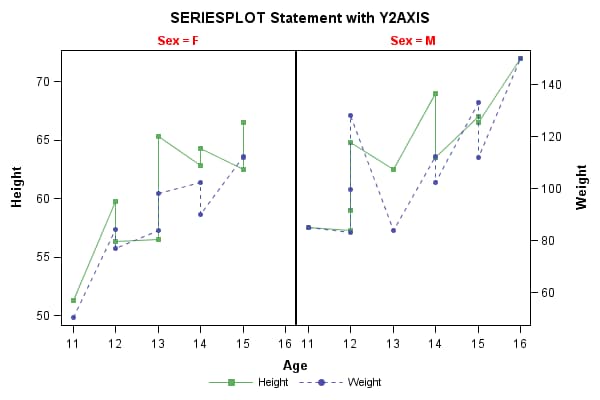
Sample 49696 - Generate side-by-side graphs with Y and Y2 axes with the Graph Template Language (GTL)[ View Code ]
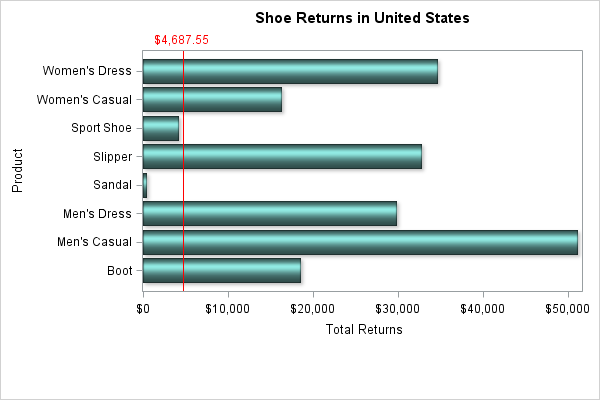
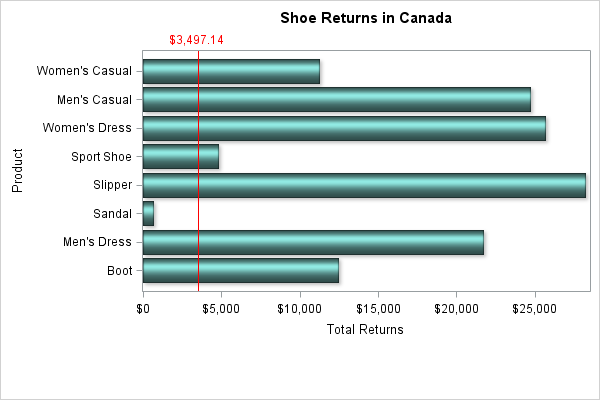
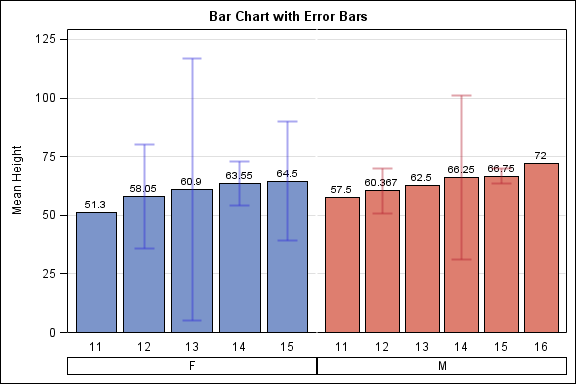
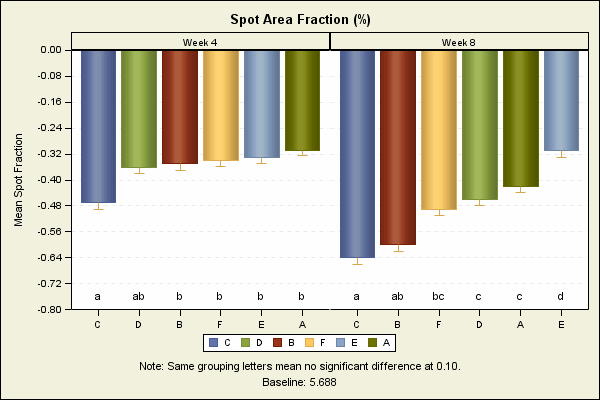
Sample 49695 - Bar chart with error bars displayed in the same cell[ View Code ]
Sample 49694 - Display Unicode values in tick values with the Graph Template Language (GTL)[ View Code ]
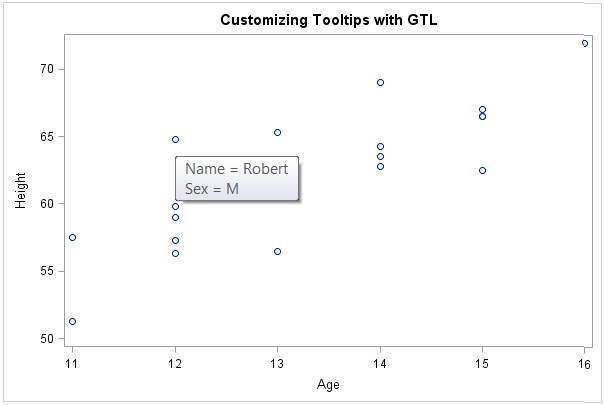
Sample 49569 - Define custom tooltips for your Graph Template Language (GTL) output[ View Code ]
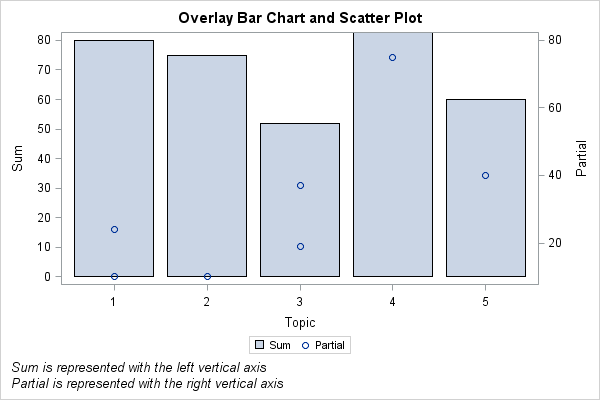
Sample 49568 - Add a right vertical axis to a graph generated with the Graph Template Language (GTL)[ View Code ]
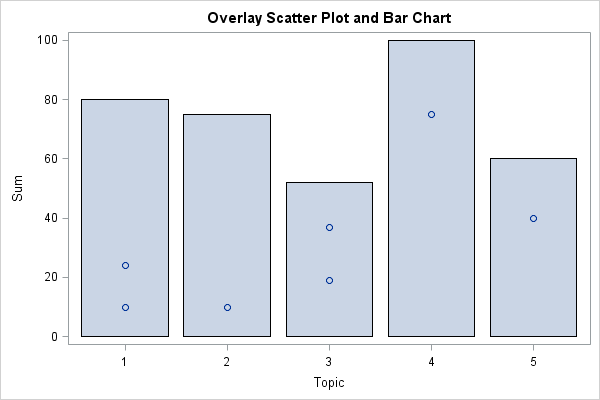
Sample 49567 - Overlay a scatter plot and a bar chart using the Graph Template Language (GTL)[ View Code ]
Sample 48499 - Rotate axis values using DRAWTEXT statements with the Graph Template Language (GTL)[ View Code ]
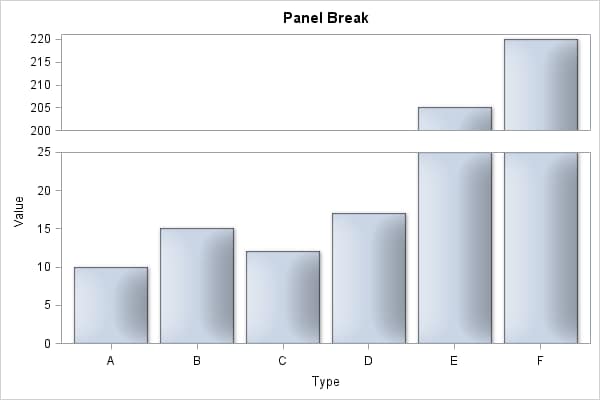
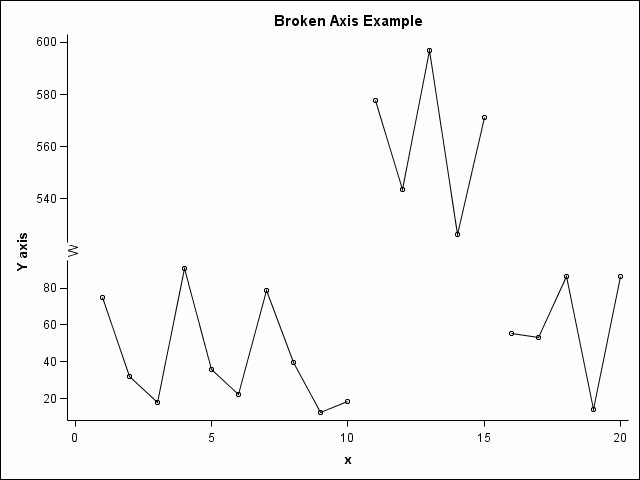
Sample 48330 - Create a vertical bar chart with a break in the axis[ View Code ]
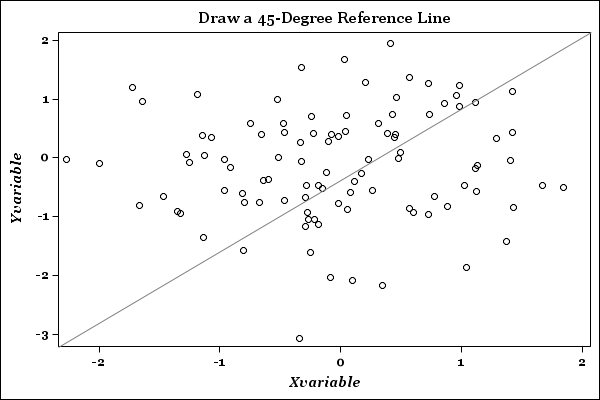
Sample 46057 - Draw a 45-degree reference line with the Graph Template Language (GTL)[ View Code ]
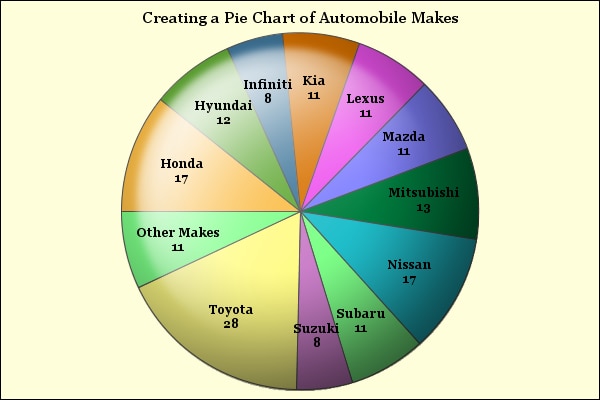
Sample 45772 - Create a pie chart using the Graph Template Language (GTL)[ View Code ]
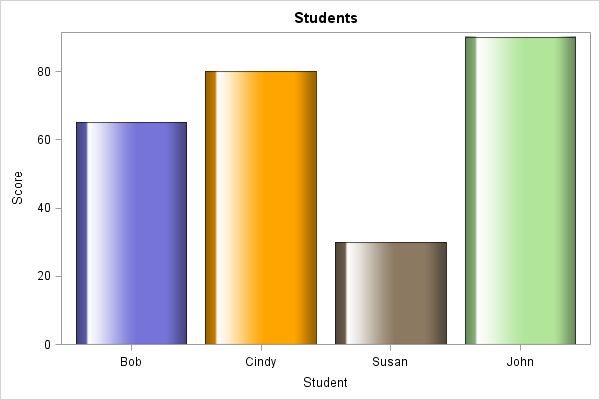
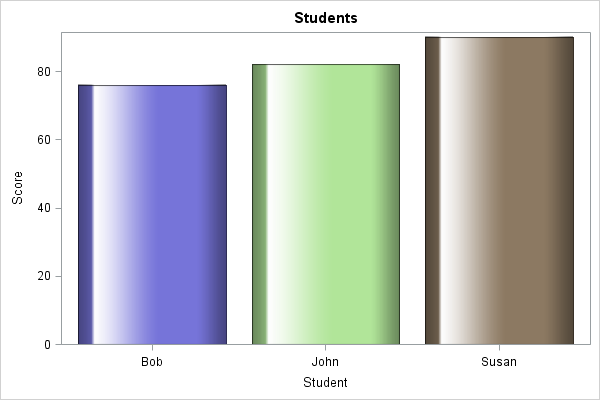
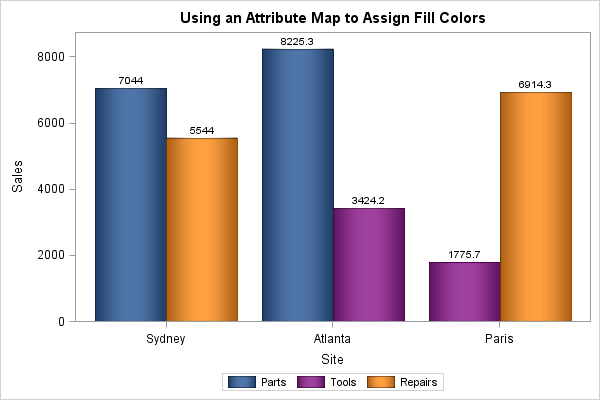
Sample 44735 - Define bar fill colors with an attribute map with the Graph Template Language (GTL)[ View Code ]
Sample 44129 - Split axis values across multiple lines with the Graph Template Language (GTL)[ View Code ]
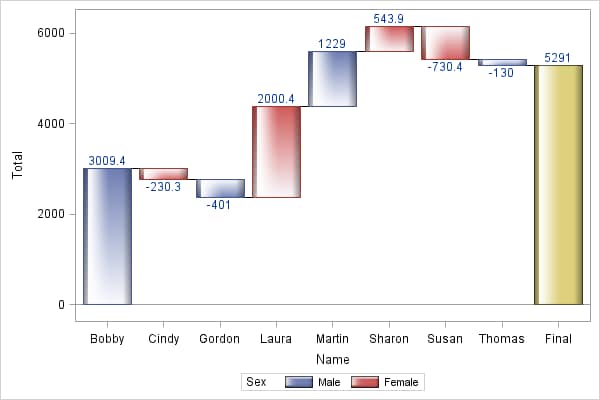
Sample 44115 - Create a waterfall chart with the Graph Template Language (GTL)[ View Code ]
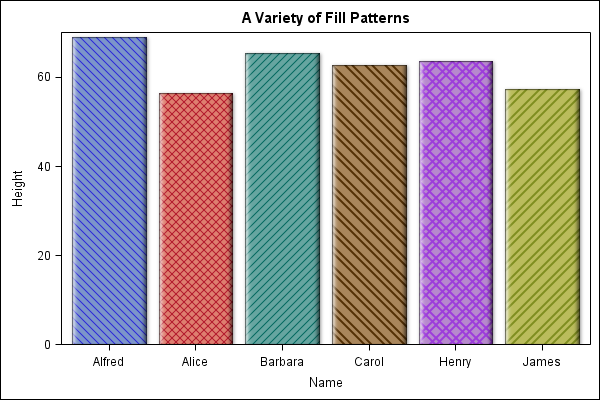
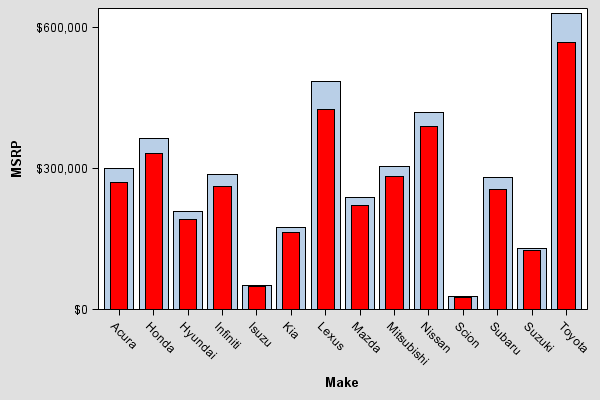
Sample 43770 - Fill patterns for bar charts[ View Code ]
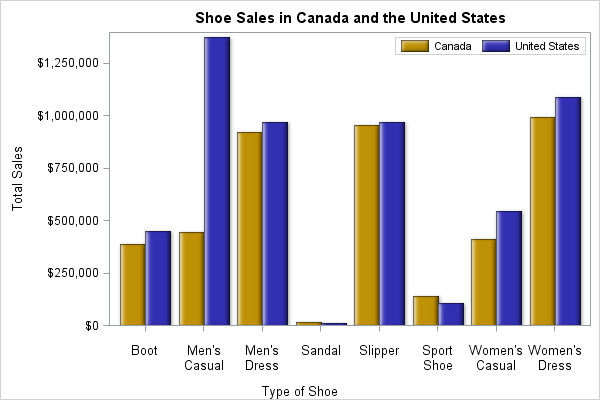
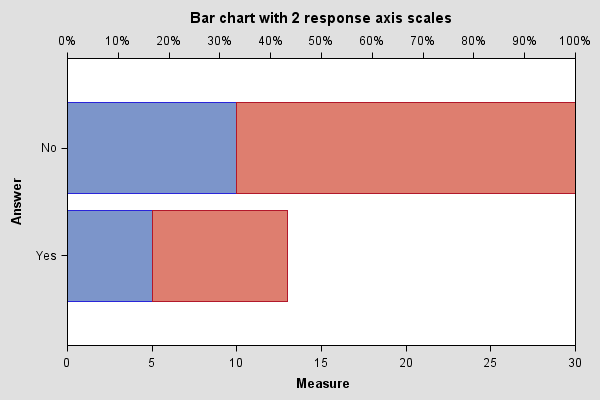
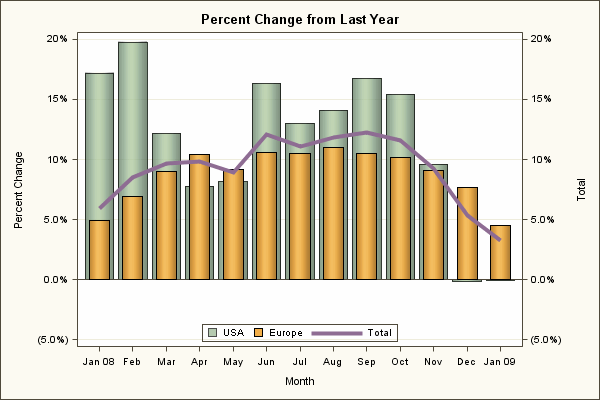
Sample 42660 - Display dual axes on a bar chart using the Graph Template Language[ View Code ]
Sample 41367 - Remove the header label borders in graphics produced with LAYOUT DATAPANEL or LAYOUT DATALATTICE in the Graph Template Language (GTL)[ View Code ]
Sample 40709 - Assign the tick value list with a dynamic variable[ View Code ]
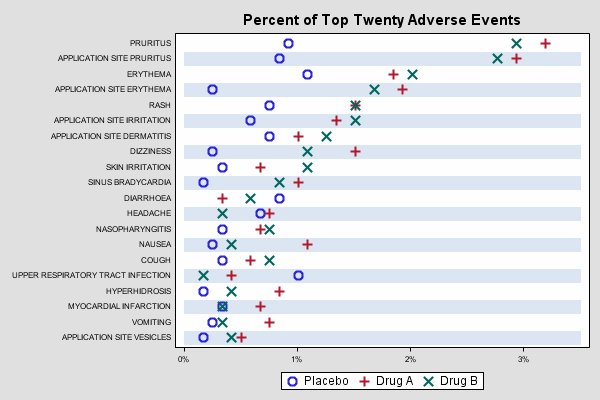
Sample 39173 - Percent of top twenty adverse events[ View Code ]
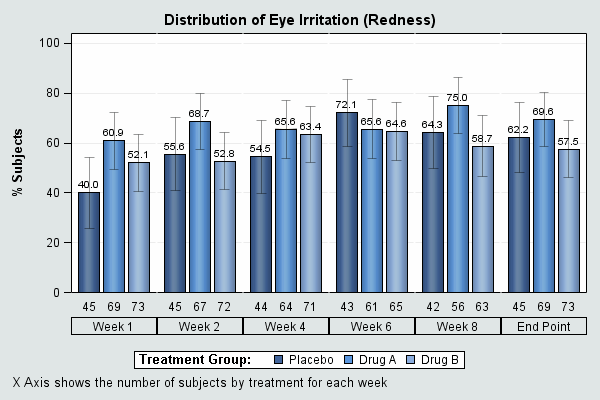
Sample 39166 - Distribution of eye irritation[ View Code ]
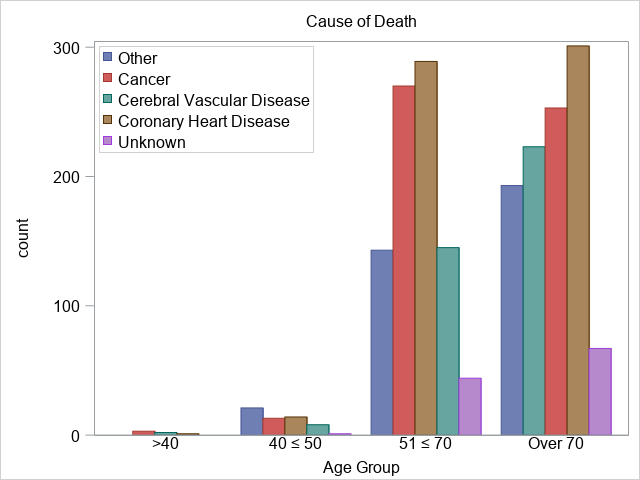
Sample 39163 - Grouped overlay bar charts[ View Code ]
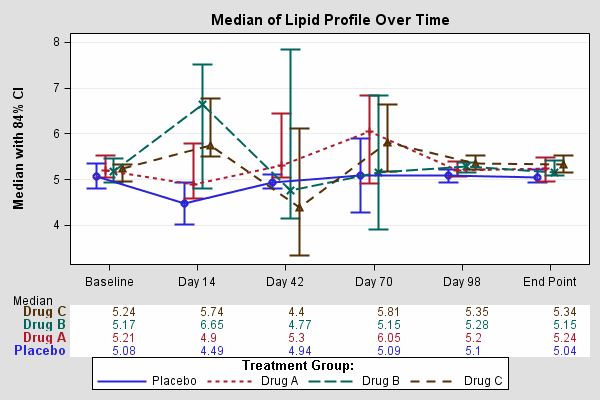
Sample 39132 - Median of lipid profile over time[ View Code ]
Sample 39101 - Grouped box plot with droplines[ View Code ]

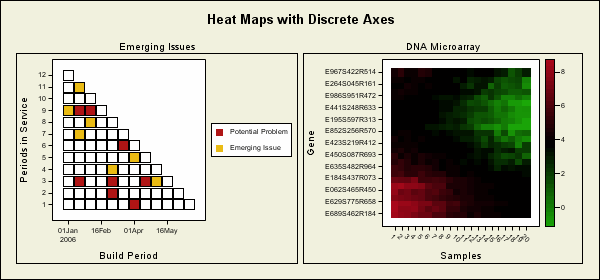
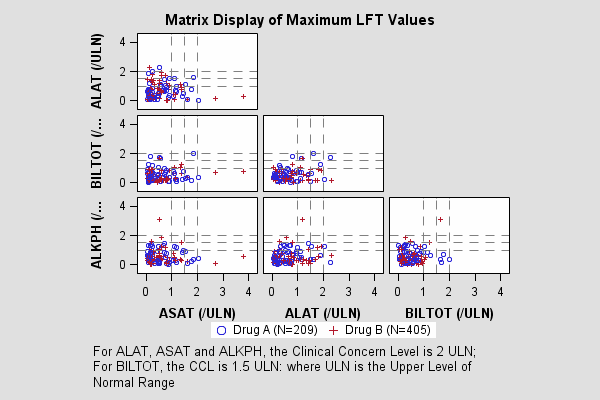
Sample 39100 - Matrix display of maximum LFT values[ View Code ]
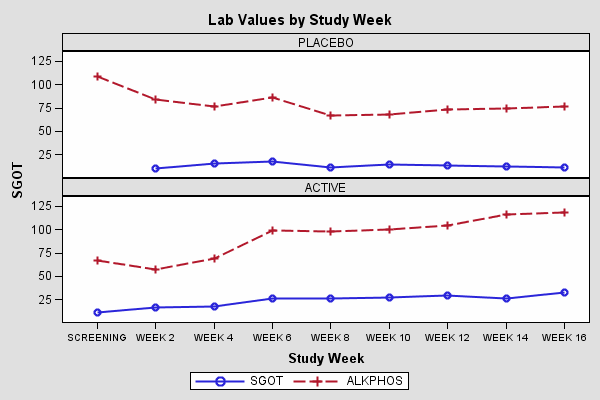
Sample 39099 - Lab values by study week[ View Code ]
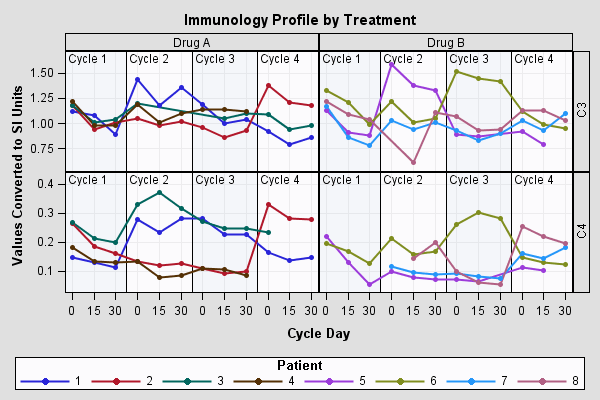
Sample 39092 - Patient profile by treatment[ View Code ]
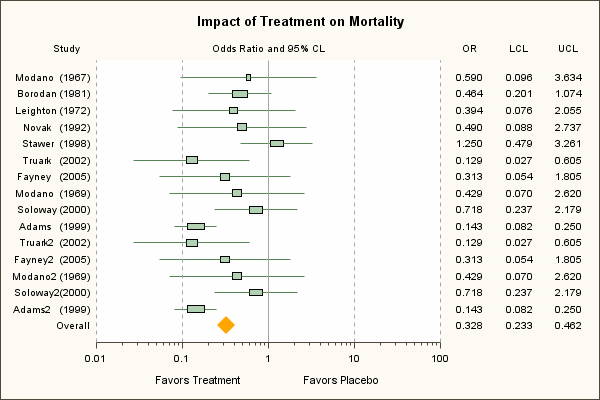
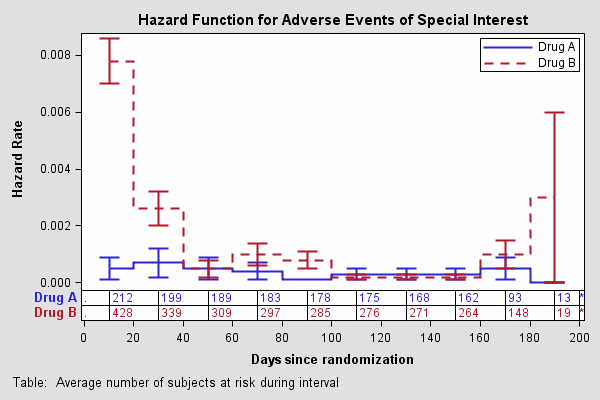
Sample 39090 - Hazard function for adverse events of special interest[ View Code ]
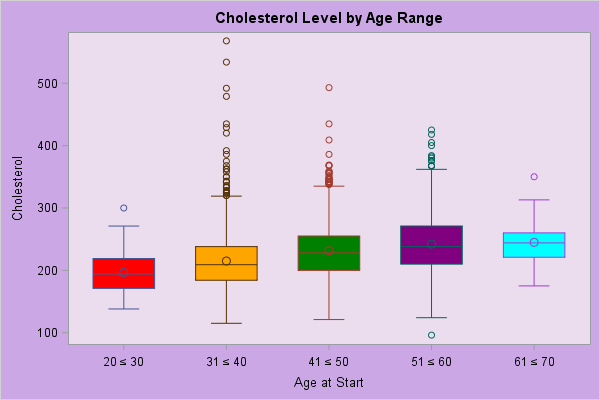
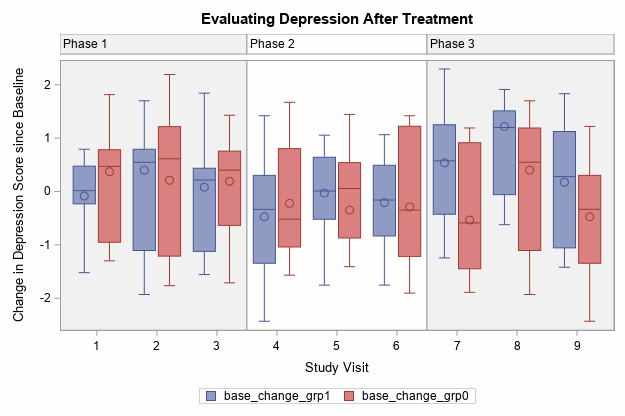
Sample 39086 - Box plot by group[ View Code ]
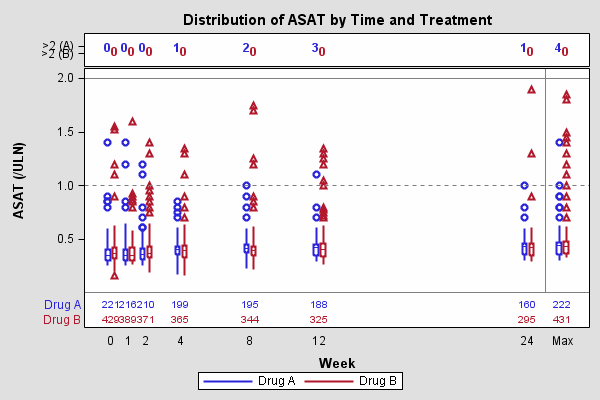
Sample 39080 - Drug distribution by time and treatment[ View Code ]
Sample 38765 - Series plot with a break in the vertical axis[ View Code ]
Sample 35938 - Create an axis label on multiple lines using the Graph Template Language (GTL)[ View Code ]
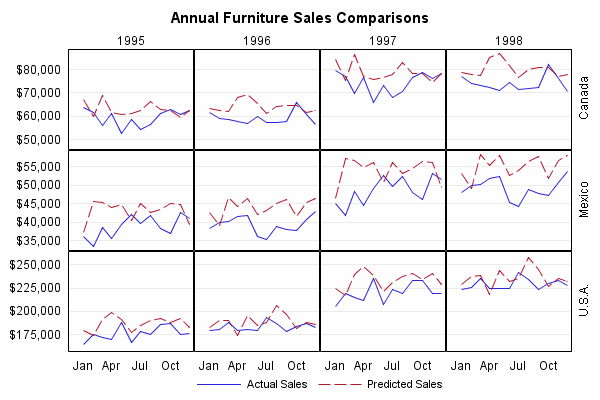
Sample 35177 - Three-Row Lattice Layout[ View Code ]
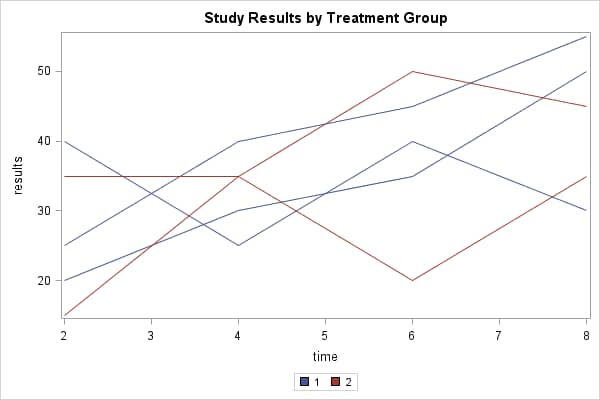
Sample 35174 - Bar Chart with a Series Plot Overlay[ View Code ]
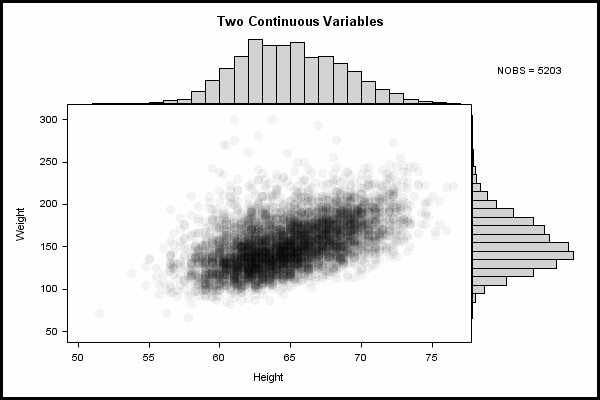
Sample 35172 - Distribution plot[ View Code ]
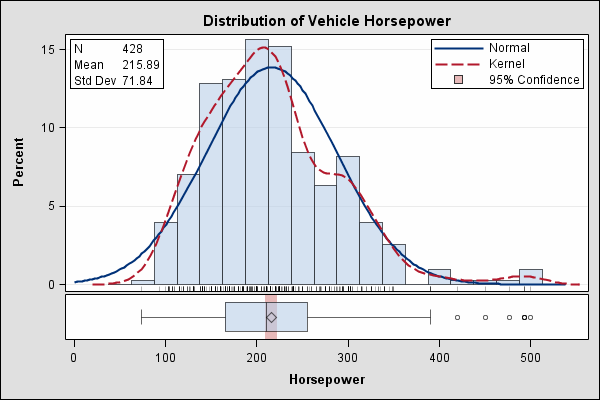
Sample 35171 - Histogram with Normal and Kernel Density Curves[ View Code ]
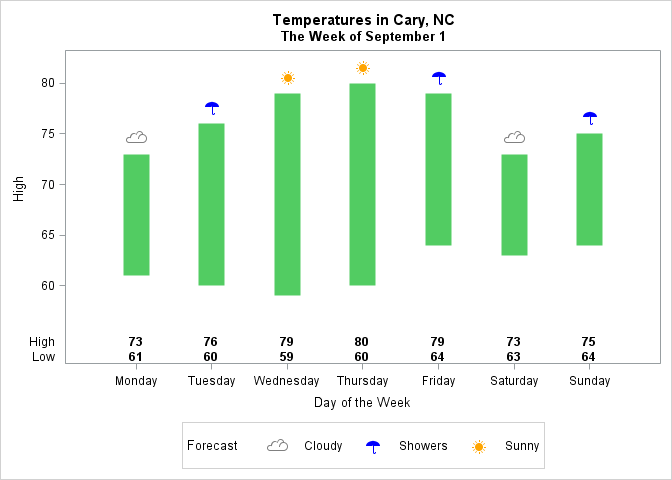
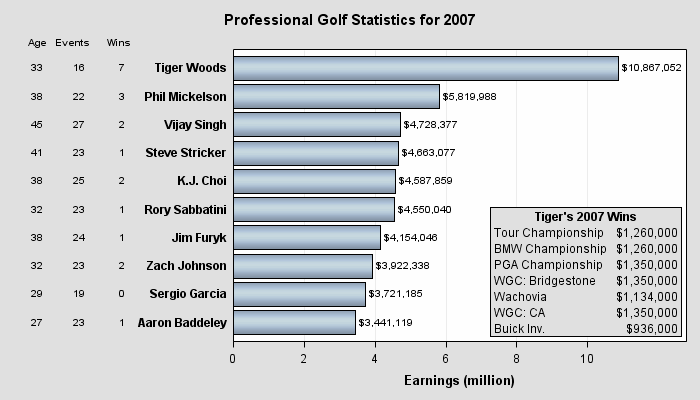
Sample 35135 - Horizontal bar chart with table information[ View Code ]
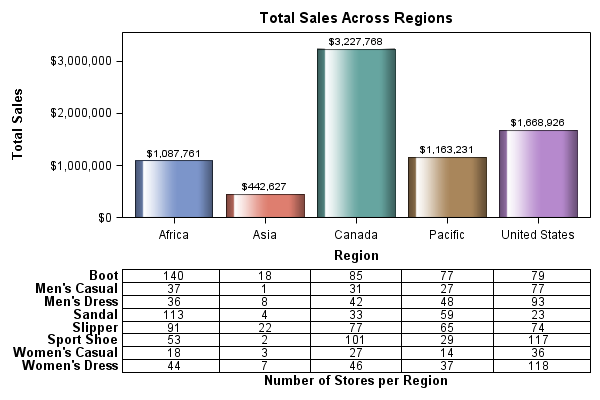
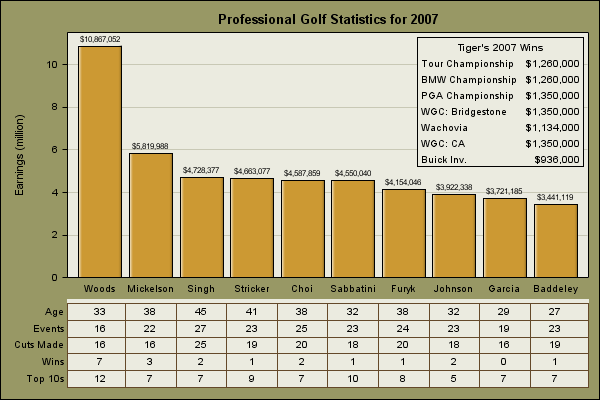
Sample 35132 - Bar chart with a data table below the graph[ View Code ]
Sample 35129 - Gridded Bar Chart with Error Bars[ View Code ]
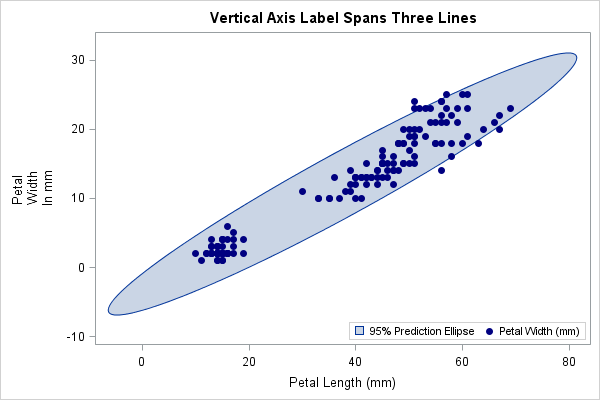
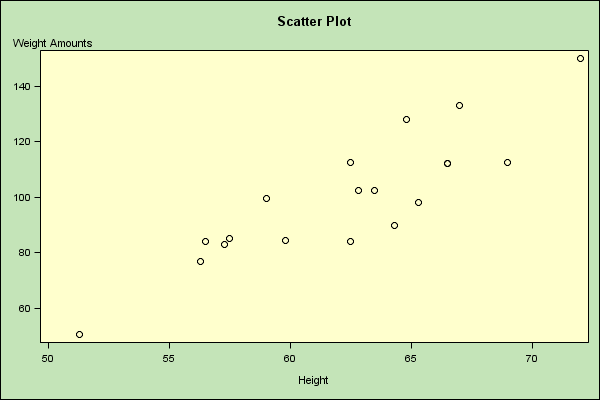
Sample 35099 - Scatter Plot with Shifted Horizontal Orientation for Vertical Axis Label[ View Code ]
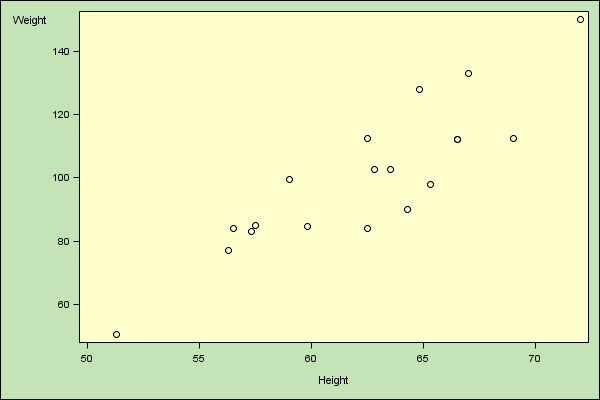
Sample 35098 - Scatter Plot with Horizontal Orientation for Vertical Axis Label[ View Code ]
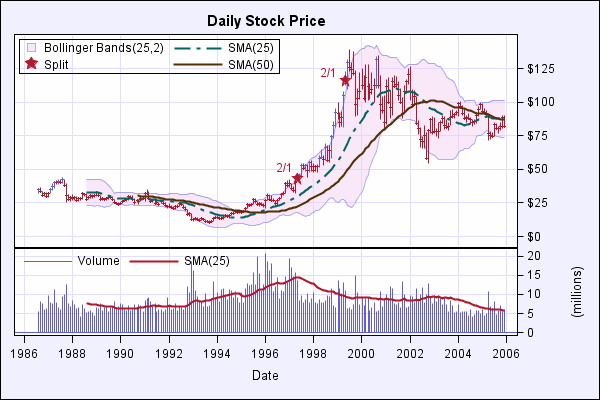
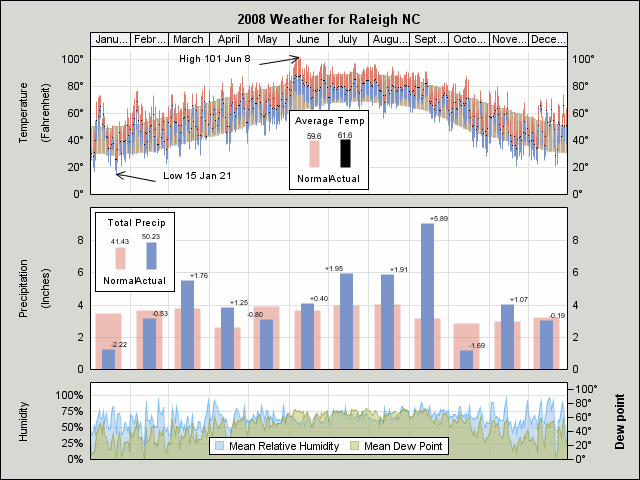
Sample 35040 - Monthly Stock Price and Volume Graph[ View Code ]