Click on the About tab within each sample for product and release requirements.
Sample 50993 - Use hardware font symbols as plotting symbols with PROC GPLOT[ View Code ]
Sample 50217 - Plot means with standard error bars from calculated data for groups with PROC GPLOT[ View Code ]

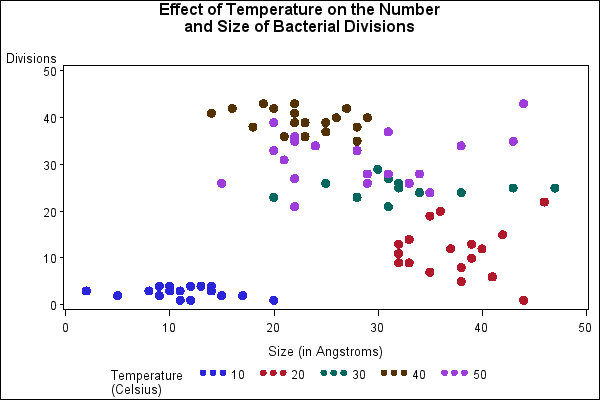
Sample 50209 - Use solid-filled symbols with PROC GPLOT[ View Code ]

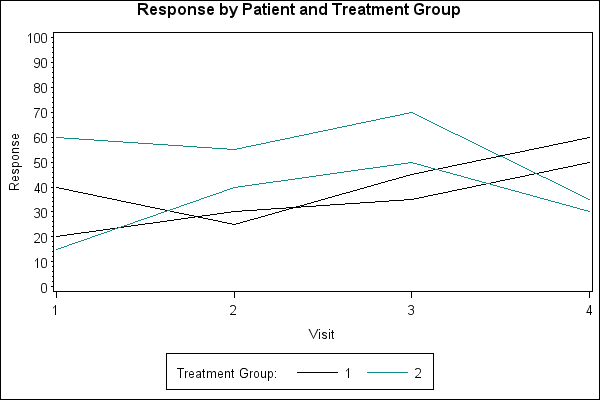
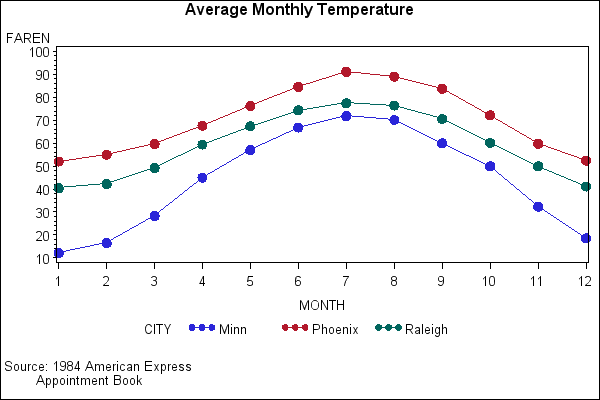
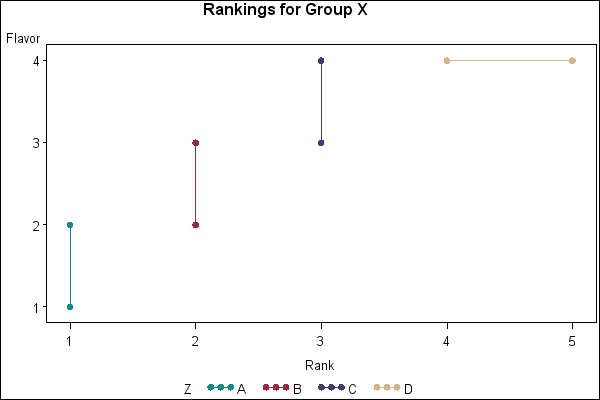
Sample 38076 - Create a spaghetti plot with the GPLOT procedure[ View Code ]
Sample 25597 - Rotate plot symbols through the colors list using a SYMBOL statement with PROC GPLOT[ View Code ]
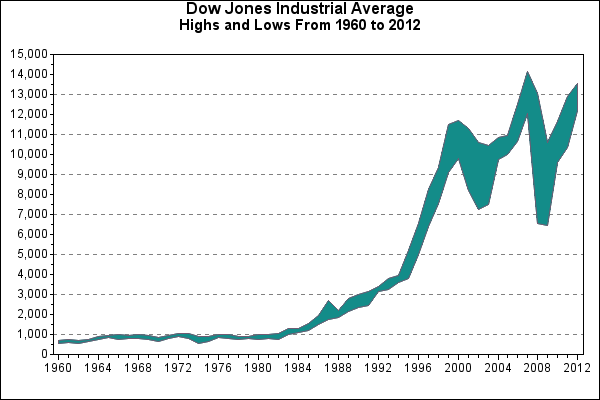
Sample 25596 - Fill the area between plot lines using a SYMBOL statement with PROC GPLOT [ View Code ]
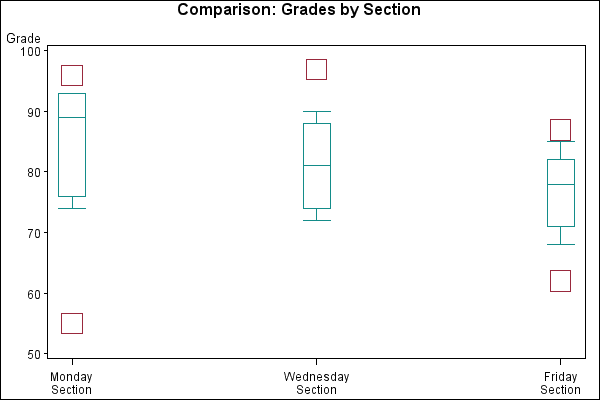
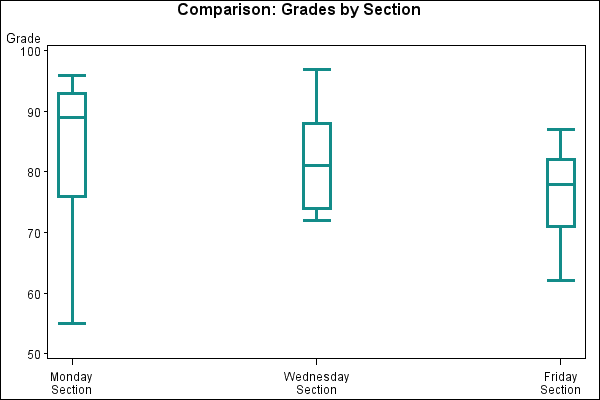
Sample 25595 - Creating and modifying box plots using the SYMBOL statement with PROC GPLOT[ View Code ]
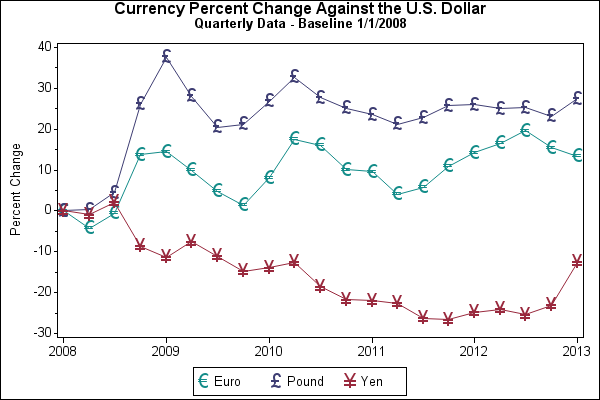
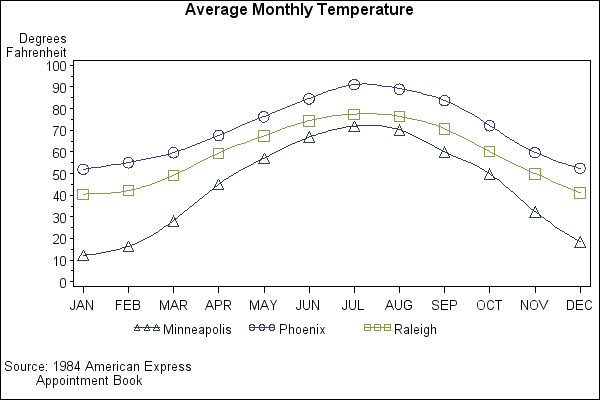
Sample 25584 - Plot three variables using PROC GPLOT[ View Code ]
Sample 25506 - Order axis tick marks with SAS® date values[ View Code ]
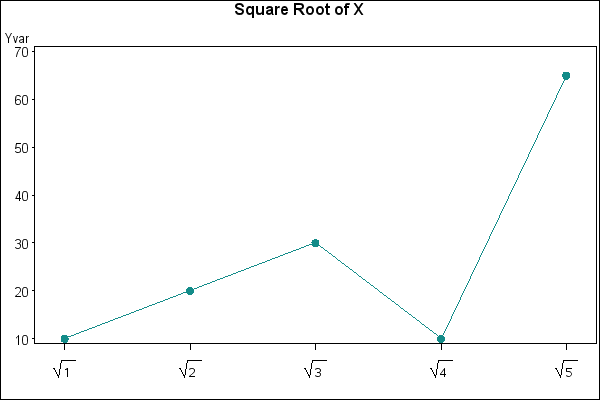
Sample 24936 - Represent tick mark values on an axis with a special symbol[ View Code ]
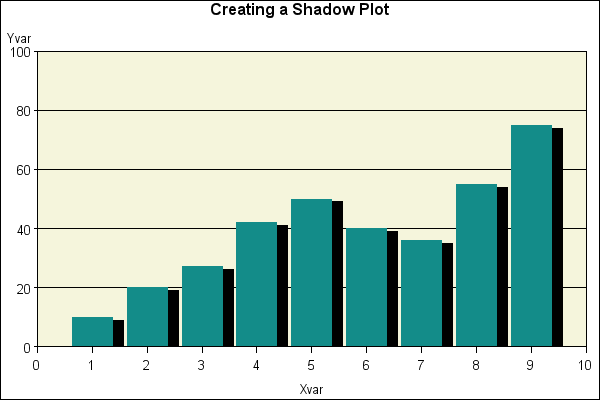
Sample 24935 - Create a shadow behind a needle plot with PROC GPLOT[ View Code ]
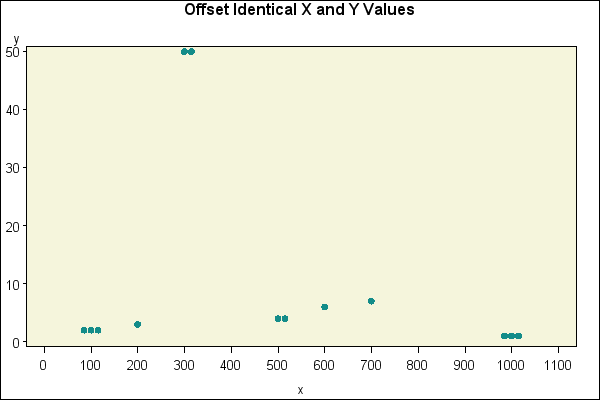
Sample 24923 - Use jittering to offset identical X and Y values with PROC GPLOT[ View Code ]
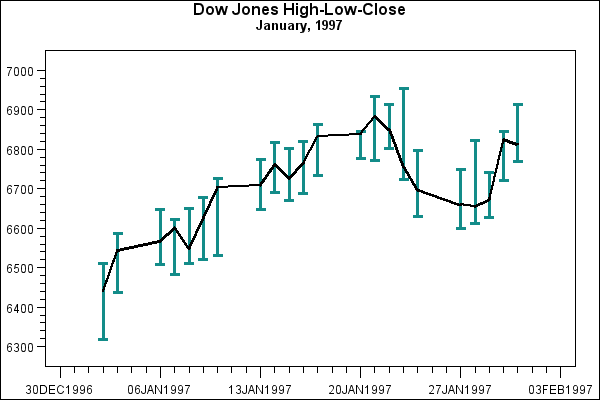
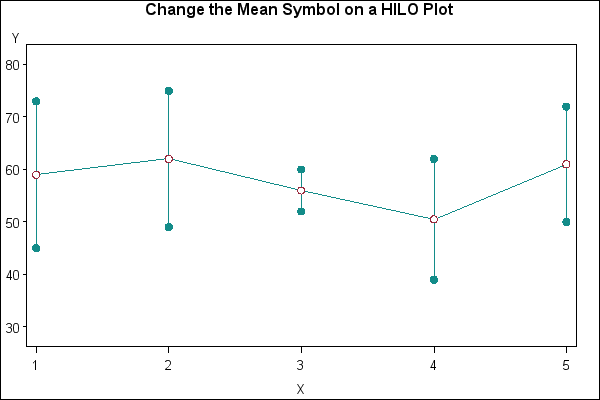
Sample 24922 - Change the mean symbol on a HILO plot with PROC GPLOT[ View Code ]
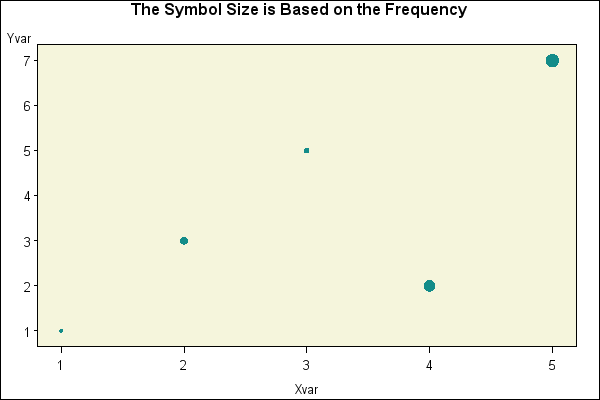
Sample 24919 - Use GPLOT to set the symbol size based on the frequency of the data[ View Code ]
Sample 24913 - Maintain symbols across BY values with PROC GPLOT[ View Code ]
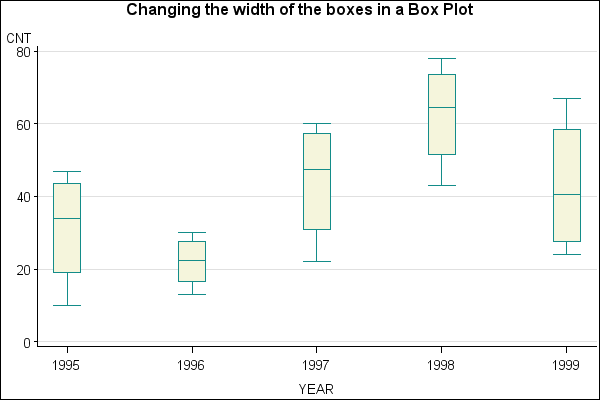
Sample 24912 - Change the width of the boxes when creating a box plot with PROC GPLOT[ View Code ]
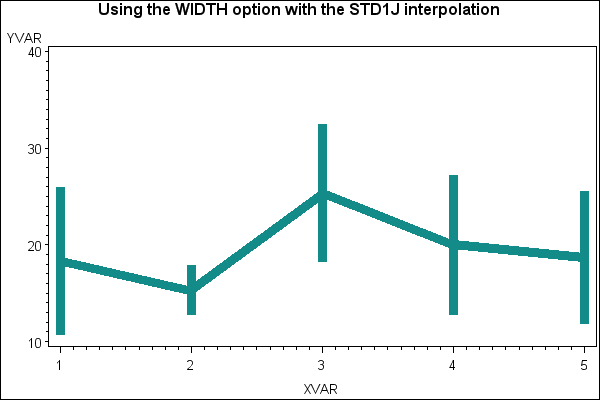
Sample 24857 - Control the thickness of interpolation lines for BOX, STD, HILO and AREA plots with PROC GPLOT[ View Code ]