Click on the About tab within each sample for product and release requirements.
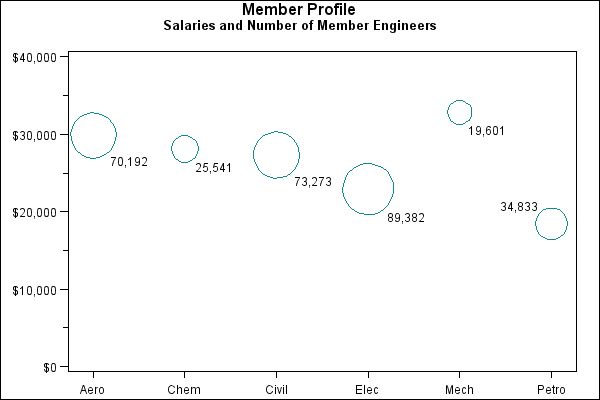
Sample 25577 - Label and size plot bubbles using PROC GPLOT View Code
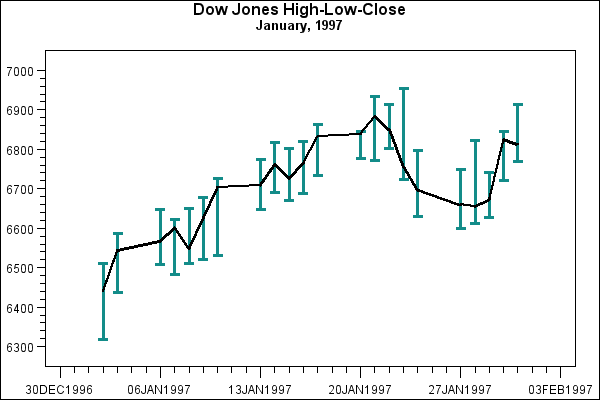
Sample 25506 - Order axis tick marks with SAS date values View Code
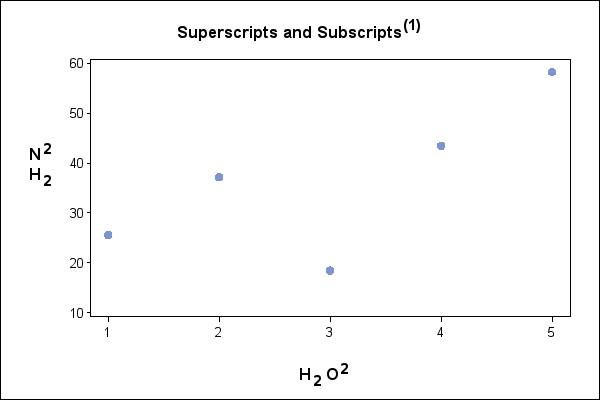
Sample 24934 - Use superscripts and subscripts with SAS/GRAPH® output View Code
Sample 24931 - Label reference lines with PROC GPLOT View Code
Sample 24930 - Label data points with PROC GPLOT and the POINTLABEL option View Code

Sample 24920 - Label data points in a two-dimensional plot using PROC GPLOT and Annotate View Code
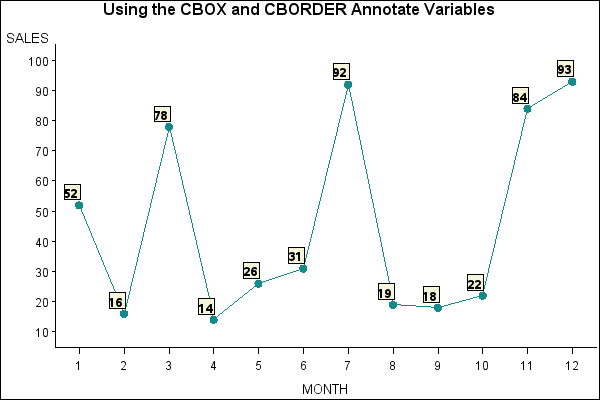
Sample 24915 - Label data points with the Annotate CBOX and CBORDER variables View Code
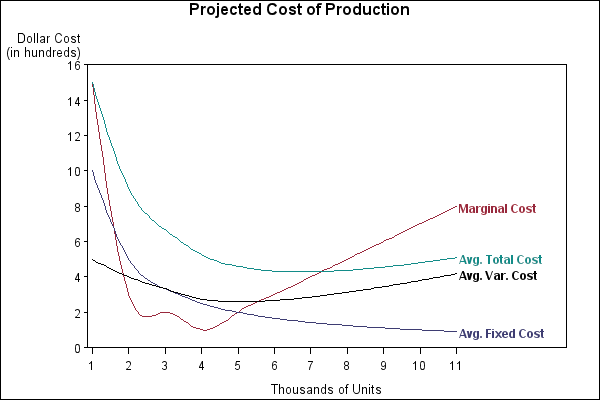
Sample 24837 - Label plot lines in an overlay plot using PROC GPLOT with Annotate View Code