Click on the About tab within each sample for product and release requirements.
Sample 25575 - Add a right vertical axis to a plot using PROC GPLOT View Code

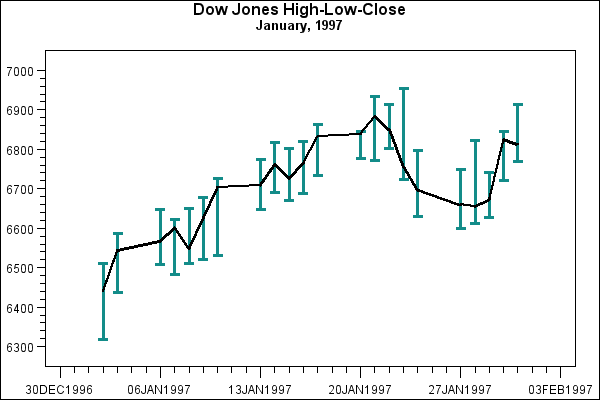
Sample 25506 - Order axis tick marks with SAS date values View Code
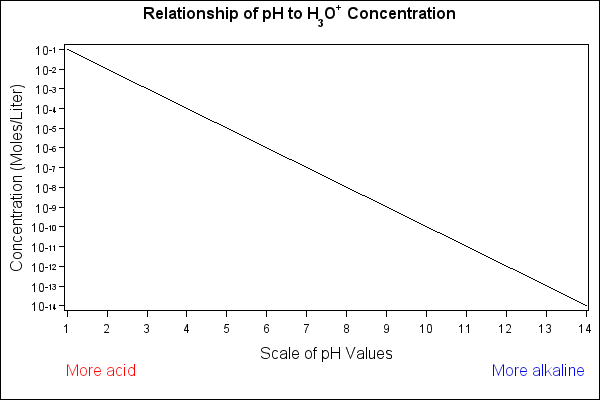
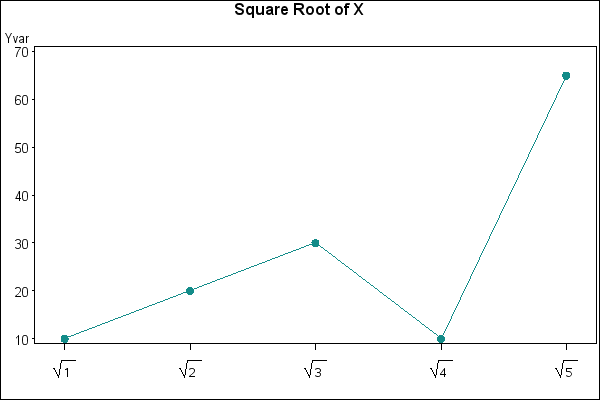
Sample 25505 - Specify logarithmic axes using PROC GPLOT View Code
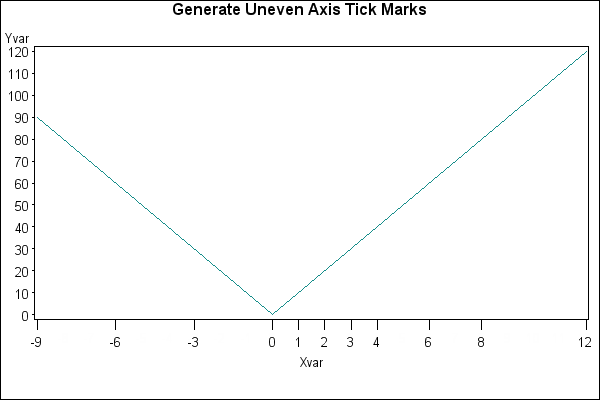
Sample 24938 - Display unevenly spaced horizontal axis tick marks View Code
Sample 24936 - Represent tick mark values on an axis with a special symbol View Code
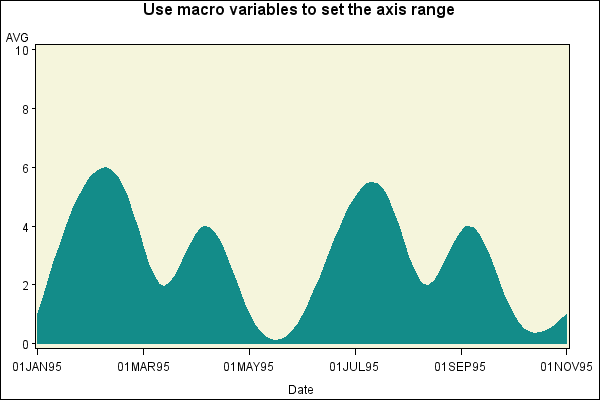
Sample 24921 - Use PROC GPLOT to control the axis range with macro variables View Code
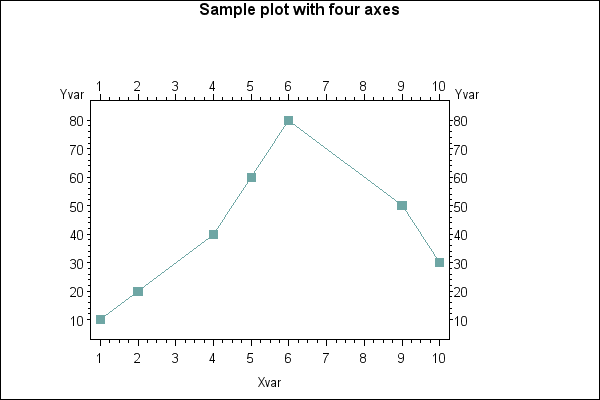
Sample 24918 - Use GPLOT with Annotate to create a plot with four axes (left, right, top and bottom) View Code
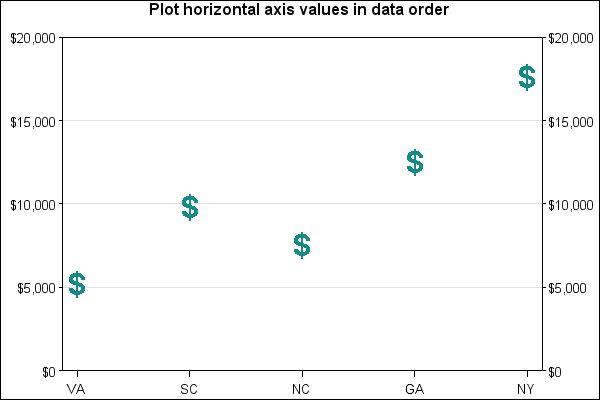
Sample 24916 - Plot horizontal axis values in data order with PROC GPLOT View Code
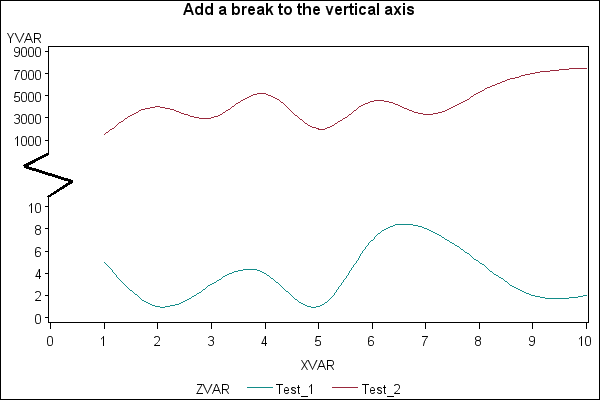
Sample 24909 - Create a break on the vertical axis of a plot View Code