Click on the About tab within each sample for product and release requirements.
Sample 40176 - Use the PLABEL= option with PROC GCHART to control the text attributes of pie slice labels[ View Code ]
Sample 36844 - Specify the radius of a pie chart using the RADIUS= option with PROC GCHART[ View Code ]
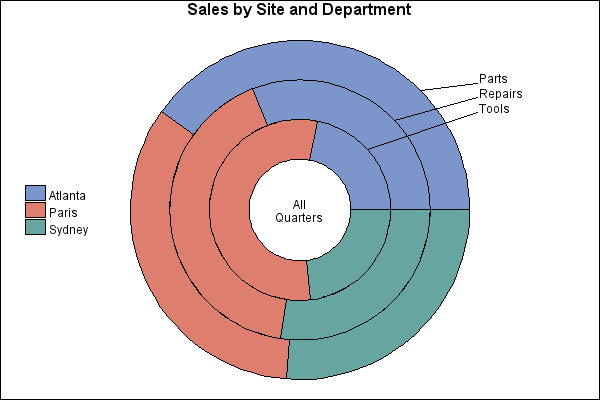
Sample 25522 - Subgroup a donut or pie chart using PROC GCHART[ View Code ]
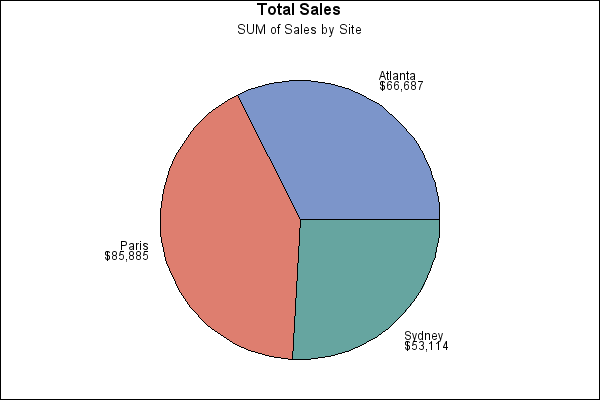
Sample 25521 - Sum statistic for a pie chart using PROC GCHART[ View Code ]
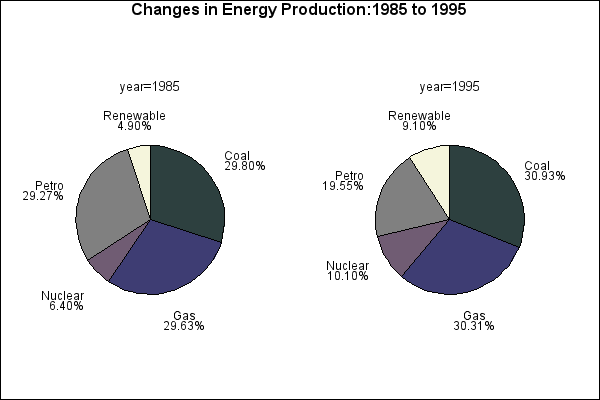
Sample 25520 - Grouping and arranging pie charts using PROC GCHART[ View Code ]
Sample 25519 - Control the midpoint order on the legend for a pie chart using the ORDER= option[ View Code ]
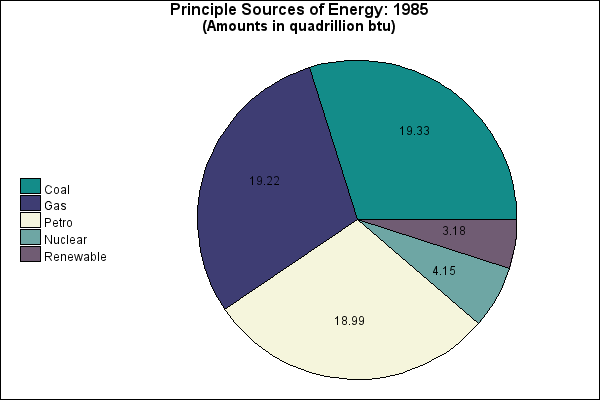
Sample 25518 - Order and label pie chart slices using PROC GCHART[ View Code ]
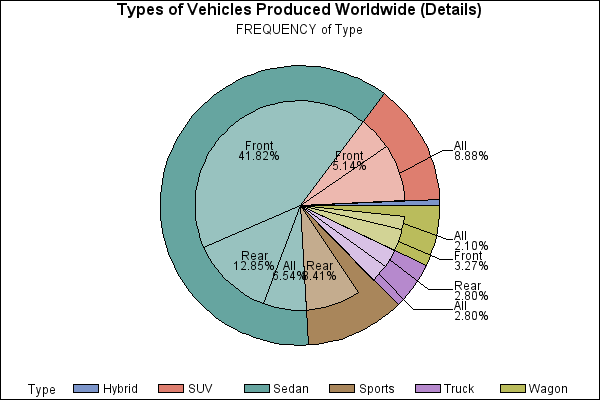
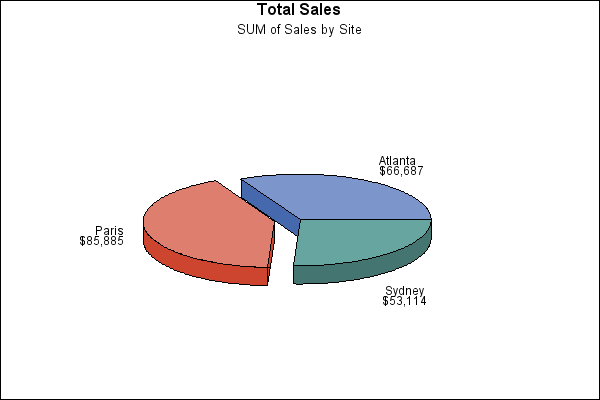
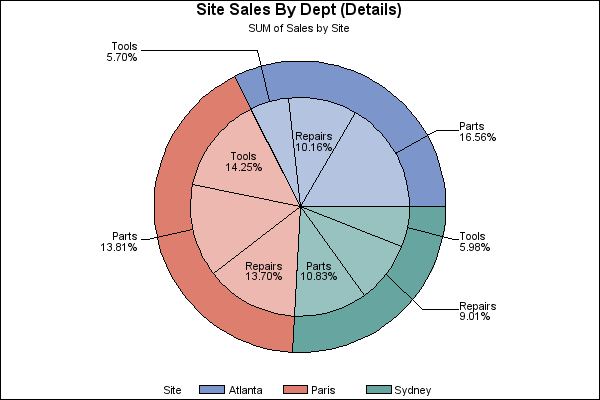
Sample 25516 - Detail pie chart using PROC GCHART[ View Code ]
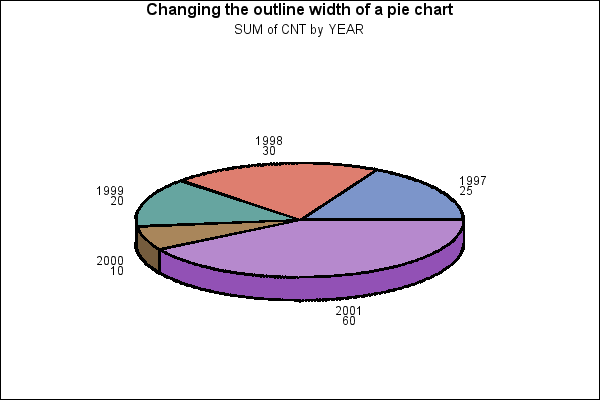
Sample 24890 - Change the outline width on a pie chart with PROC GCHART[ View Code ]
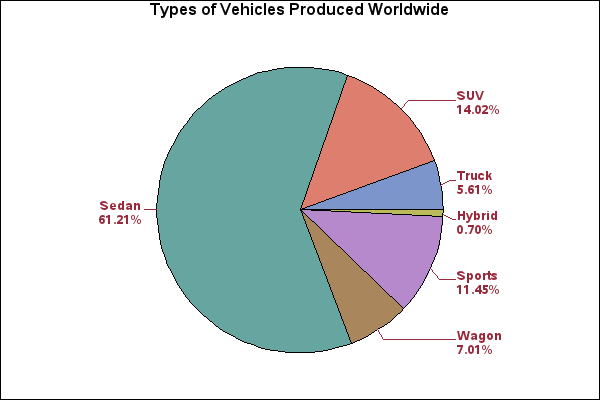
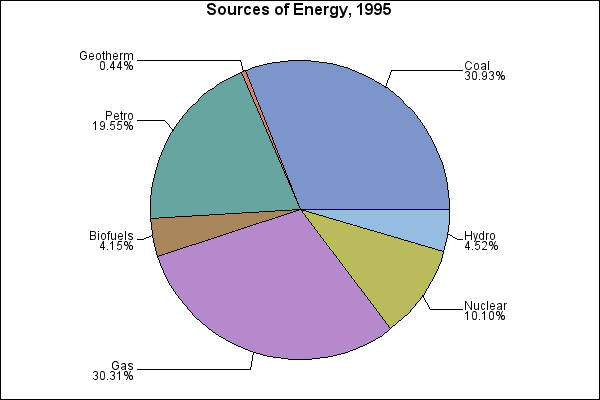
Sample 24877 - Format percentage values on a pie chart with PROC GCHART[ View Code ]