Graphics Samples Output Gallery
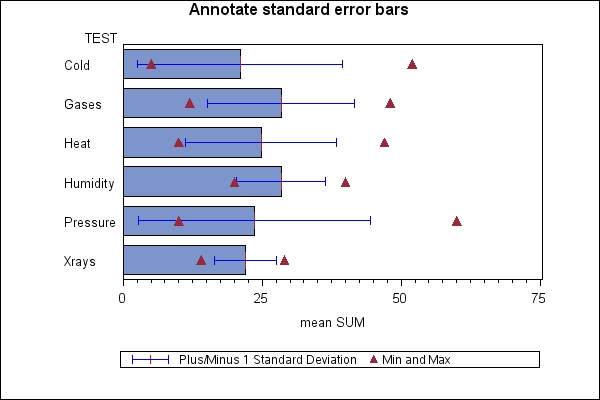
Click on the About tab within each sample for product and release requirements.Sample 24884 - Annotate +/- one standard deviation of the mean with PROC GCHART - Example 2 View Code
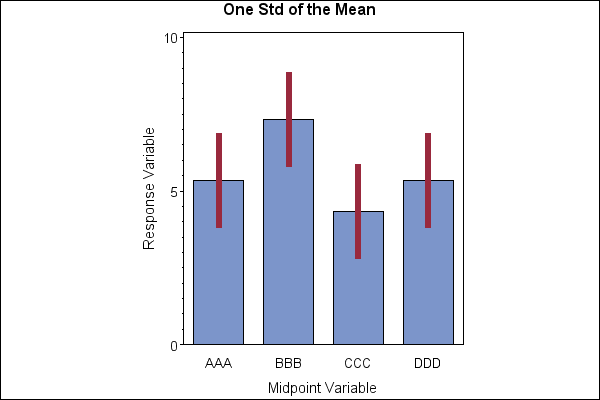
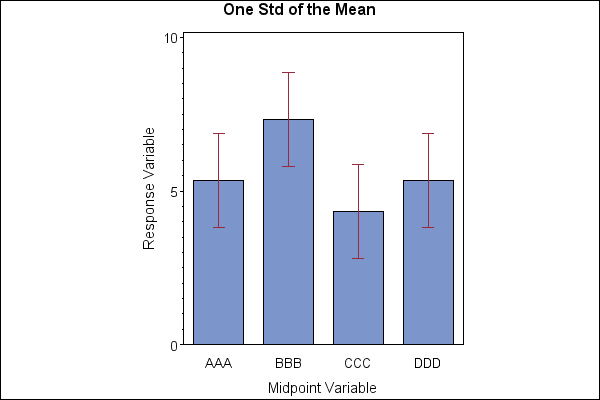
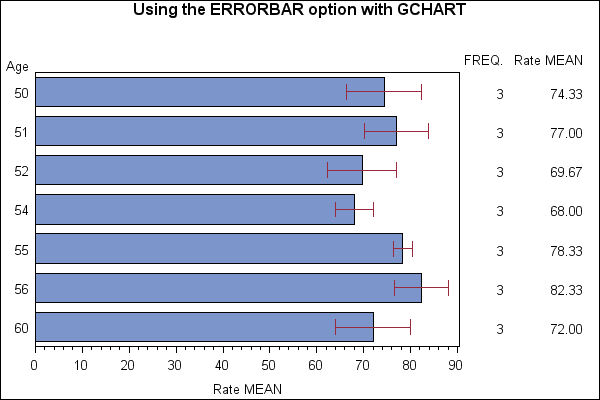
Sample 24871 - Use PROC GCHART with Annotate to add bars at +/- 1, 2 or 3 STD or STDERR of the mean View Code