Click on the About tab within each sample for product and release requirements.
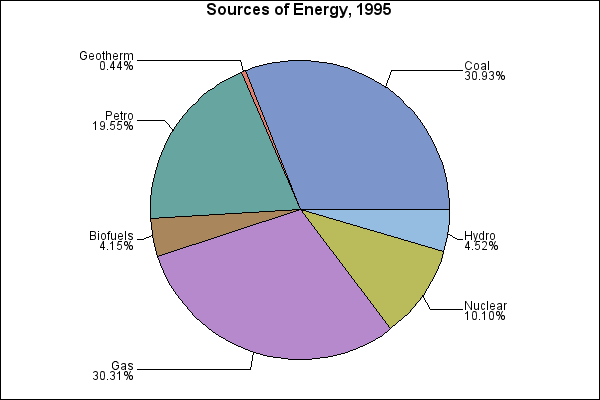
Sample 25518 - Order and label pie chart slices using PROC GCHART View Code
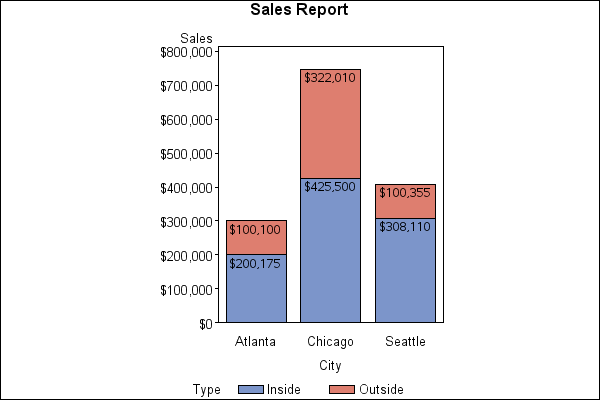
Sample 25504 - Label subgroups in a vertical bar chart using PROC GCHART View Code

Sample 24887 - Annotate values for each subgroup bar with PROC GCHART View Code
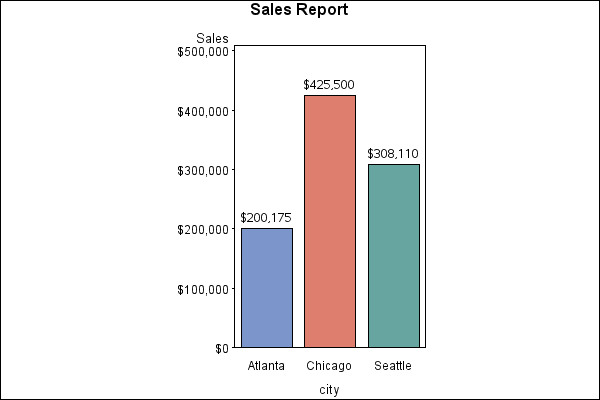
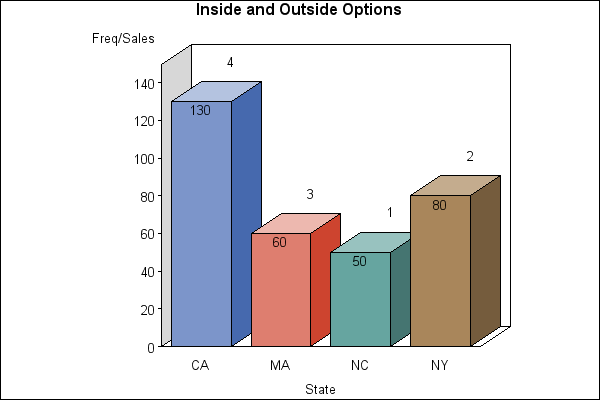
Sample 24886 - Annotate values above each midpoint bar with PROC GCHART View Code
Sample 24885 - Use PROC GCHART to label midpoint values longer than 32 characters View Code

Sample 24873 - Control the placement of statistics with PROC GCHART View Code
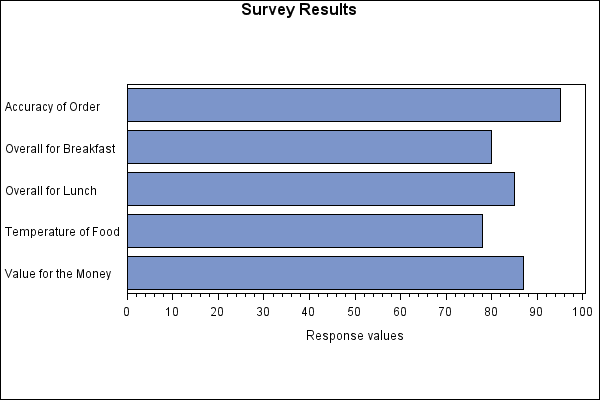
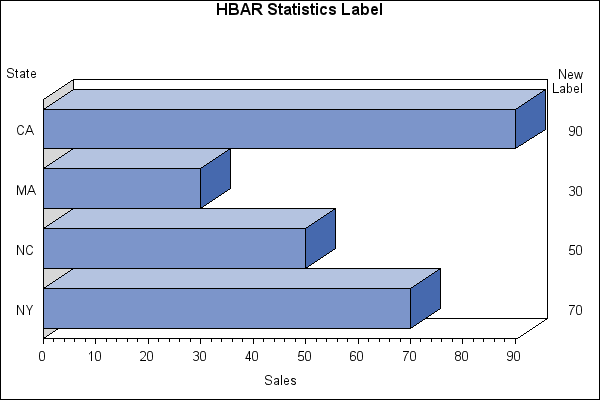
Sample 24870 - Modify the HBAR statistics label with PROC GCHART View Code
Sample 24856 - Use PROC GCHART with midpoint values longer than 16 characters View Code