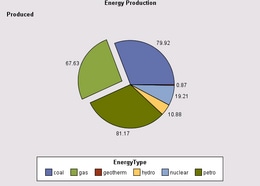
A PieChartModel can emphasize one or more pie slices by offsetting (exploding) them from the pie center. Alternatively, it can de-emphasize slices by making them invisible.
To explode or hide pie slices,
The following code fragment explodes a pie slice that has the value gas:
String[] slice = new String[] {new String("gas")};
PieChartModel graphModel=pieChart.getGraphModel();
graphModel.setExplodedCategories(slice);
A PieChartModel can aggregate midpoint statistic values that fall below a specified threshold value or that exceed a maximum total number of slices for the pie chart. Rather than display each of the below-threshold midpoint values as a separate pie slice, the model aggregates those values into a new category that is identified as Other.
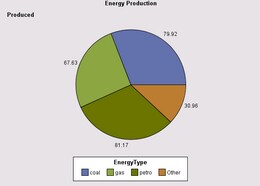
To specify a threshold value for aggregating midpoint values, call the setOtherThreshold() method, which takes an argument of type OtherThreshold. The following code fragment aggregates midpoint values that are below a threshold value of 10%:
graphModel.setOtherThreshold(new OtherThreshold("10 percent"));
A PieChartModel can display a donut hole in the center of a pie chart by calling the setDonutHoleSize() method to set a radius that is a percentage of the entire pie radius.
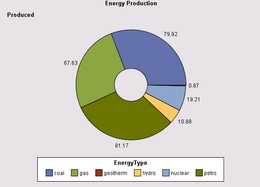
The following code fragment specifies a hole with a 30% radius:
graphModel.setDonutHoleSize(30);
The PieChartModel can be used to change a pie chart's general display properties, as shown in the following example:
PieChart pieChart = new PieChart();
PieChartModel pieChartModel = pieChart.getGraphModel();

// Set the slice order and direction
pieChartModel.setSliceOrder(GraphConstants.SORT_ASCENDING);
pieChartModel.setReverseDirection(true);

// Change the pie slice outline color
pieChartModel.getDataElementStyles().getOutlineLineStyle().setColor(Color.blue);

// Define a new set of solid fills for the
// slice elements to be [red, green, blue].
FillStyles[] fillStyles = new FillStyles[] {
   new FillStyle(Color.red)
 , new FillStyle(Color.green)
 , new FillStyle(Color.blue)
};
pieChartModel.getDataElementStyles().setFillStyles(fillStyles);
Rather than changing individual properties, it may be easier to use the PieChart to set a graph style, which makes it easier to manage multiple display properties.
A PieChartModel can be used to modify the line style (color, width, visibility, ...) of any of the various lines in a PieChart.
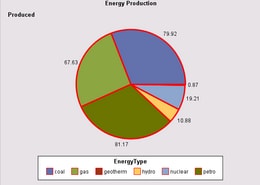
The following table shows the lines you can set and the method(s) to call to access and/or set the line attributes.
| To change ... | Call ... |
|---|---|
| pie slice outlines | getDataElementStyles().setOutlineLineStyle(LineStyle) |
| legend frame | getLegendModel().setFrameLineStyle(LineStyle) |
| missing-values lines | getDataElementStyles().setMissingLineStyle(StrokeLineStyle) |
| column axis lines (available when ColumnVariable role is used) |
getColumnAxisModel().setFrameLineStyle(LineStyle) |
| row axis lines (available when RowVariable role is used) |
getRowAxisModel().setFrameLineStyle(LineStyle) |
| frame lines around column/row cells
(available when ColumnVariable and/or RowVariable roles are used) |
setFrameLineStyle(LineStyle) |
The following code fragment specifies a 3-point red line for slice outlines:
PieChartModel graphModel=pieChart.getGraphModel();

LineStyle lineStyle=new LineStyle(
          java.awt.Color.red,
          new com.sas.measures.BaseLength(3, "pt"),
          com.sas.components.GraphConstants.TRUE);

graphModel.getDataElementStyles().setOutlineLineStyle(lineStyle);
PieChartModel properties are bound properties. Modifying a property triggers a PropertyChangeEvent. The PieChart asynchronously updates when a PropertyChangeEvent is received from the PieChartModel. Similarly, modifying a property in any of the PieChartModel's contained models triggers a PropertyChangeEvent. A PropertyChangeEvent from contained models will bubble up to cause a PropertyChangeEvent to be fired from the PieChartModel.
For example, the following call
pieChartModel.getColorLegendModel().getValueTextStyle().setColor(java.awt.Color.yellow);
would cause the legend's value text style model to fire a "color" PropertyChangeEvent, causing legend model to fire a "valueTextStyle" PropertyChangeEvent, causing the PieChartModel to fire a "colorLegendModel" PropertyChangeEvent. This bubbling up of events enables the graph or any other listener to manage updates at a higher level of containment.