<%// DonutHole:%>
<%
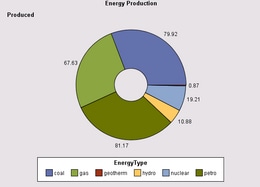
// To display a donut hole in the center of a pie chart,
// get the chart's graph model and call the model's
// setDonutHoleSize() method to set a radius that is a
// percentage of the entire pie radius.
%>
<%@page import="
com.sas.servlet.tbeans.graphics.html.PieChart,
com.sas.graphics.components.piechart.PieChartTableDataModel,
com.sas.graphics.components.AnalysisVariable,
com.sas.graphics.components.ClassificationVariable,
com.sas.swing.models.TableModelAdapter,
com.sas.models.SimpleTable"
%>
<%
// Create a PieChart instance
PieChart pieChart = new PieChart();
// Create a simple SAS table and add data to it
SimpleTable table = new SimpleTable();
%>
<%@ include file="EnergyData.jsp" %>
<%
// Convert a simple SAS table to a simple Java Swing table
TableModelAdapter tma = new TableModelAdapter(table);
tma.setFormattedDataUsed(false);
// Create a data model and attach the data source
PieChartTableDataModel dataModel=
new PieChartTableDataModel(tma);
// Assign the data model to the PieChart
pieChart.setDataModel(dataModel);
// Hide the legend
pieChart.getGraphModel().getLegendModel().setVisible(false);
// Specify a donut hole
pieChart.getGraphModel().setDonutHoleSize(30);
// Assign the Category variable role, and optionally the
// Response variable role, to appropriate variable(s)
dataModel.setCategoryVariable(
new ClassificationVariable("EnergyType"));
dataModel.setResponseVariable(
new AnalysisVariable("Produced"));
// Set a graph title
pieChart.getTitle1().setText("Energy Production");
// Set HTTP-specific response and request functionality
pieChart.setResponse(response);
pieChart.setRequest(request);
// Write the chart to the display
pieChart.write(out);
%>