
In a Gantt chart, the horizontal axis represents dates that are displayed as time intervals and the vertical axis represents a sequence of tasks in the data. You can access either axis to change its default characteristics. You can also show dependencies among tasks by displaying tasks hierarchically on the task axis.
The date axis is a CompoundTimeAxisModel that runs horizontally across the top of the chart. By default, the axis contains three rows of time values that display related time increments. The increments and date format that are displayed depend on the increments and format of the dates in the data. For example, the top row might display months, the middle row weeks, and the bottom row days.
Each row in the date axis displays a separate TimePeriodModel. To access the date axis and its rows, use the following methods:
GanttChartModel.getDateAxisModel()CompoundTimeAxisModel.getTimePeriodModel1()CompoundTimeAxisModel.getTimePeriodModel2()CompoundTimeAxisModel.getTimePeriodModel3()For example, the following code fragment displays DAY values in the top row of the date axis and hides the second and third axis rows:
// Get the Date axis and change its characteristics
   GanttChartModel ganttChartModel = ganttChart.getGraphModel();
   CompoundTimeAxisModel dateAxis = ganttChartModel.getDateAxisModel();
   TimePeriodModel period1 = dateAxis.getTimePeriodModel1();
   period1.setTimeLength(new TimeLength(1, GraphConstants.TIME_INTERVAL_DAY));
   dateAxis.getTimePeriodModel2().setVisible(false);
   dateAxis.getTimePeriodModel3().setVisible(false);
The task axis is a
TableAxisModel that runs vertically
down the left side of the chart. To access the task
axis, call the GanttChartModel.getTableAxisModel() method.
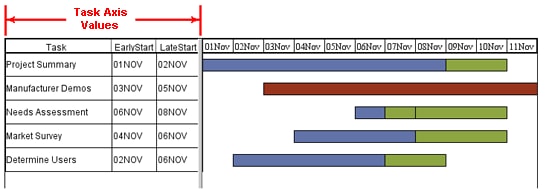
By default, the task axis values are not displayed on the axis line. To display the values, get the chart's TableAxisModel and assign a TableAxisColumn to it. The TableAxisColumn must be defined as an array that specifies one or more variables from the schedule data.
Each variable that is specified for the task axis is represented as a column in the axis display, and the variable values form the rows of the axis table. If the Task variable is assigned to the axis and the data model defines a task hierarchy for its values, the axis display automatically indents the sub-tasks (child tasks) under their parent tasks.
The following code fragment gets a chart's task axis and assigns the variables Task, EarlyStart, and EarlyFinish to the axis display. The code also assigns a 1.5 inch width to the first column so that task values are not truncated in the chart display.
// Get the task axis and change its characteristics
   GanttChartModel ganttChartModel = ganttChart.getGraphModel();
   TableAxisModel tableAxisModel = ganttChartModel.getTableAxisModel();
    TableAxisColumn tac[] = new TableAxisColumn[3];
      tac[0] = new TableAxisColumn(new Variable("Task"));
      tac[0].setWidth(new BaseLength(1.5, "in"));
      tac[1] = new TableAxisColumn(new Variable("EarlyStart"));
      tac[2] = new TableAxisColumn(new Variable("LateStart"));
    tableAxisModel.setColumns(tac);
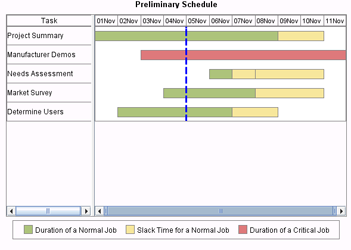
A GanttChartModel can set a reference line that descends perpendicularly from the date axis and is referred to as a timenow line. The timenow line is constructed from a ReferenceLineModel, which sets a line style and axis position for the line.
ReferenceLineModel.setLineStyle()
to set the line as the style for the timenow line.
SASDateTimeFormat.informat().
ReferenceLineModel.setPosition()
GanttChartModel.setTimeNowReferenceLineModel(), which takes
a ReferenceLineModel as its argument.
The following code fragment creates a blue dashed line and uses it as a timenow line for a Gantt chart:
// Create a StrokeLineStyle that defines a line style for the timenow line
   StrokeLineStyle blueLine = new StrokeLineStyle(
     StrokeLineStyle.SASGRAPH_LINE04,
     Color.blue,
     new BaseLength(3, "pt"),
     GraphConstants.TRUE);

// Create a SAS date to use for the timenow reference line's axis position
   SASFormat fmt = SASFormat.getInstance("DATE5.");
   double axisPosition = ((SASDateTimeFormat)fmt).informat("05NOV");

// Create a ReferenceLine with the defined line style and axis position
   ReferenceLineModel refLine = new ReferenceLineModel();
   refLine.setLineStyle(blueLine);
   refLine.setPosition(axisPosition);
   refLine.setInFront(true);

// Set the reference line as the graph's TimeNowModel
   GanttChartModel graphModel = ganttChart.getGraphModel();
   graphModel.setTimeNowReferenceLineModel(refLine);
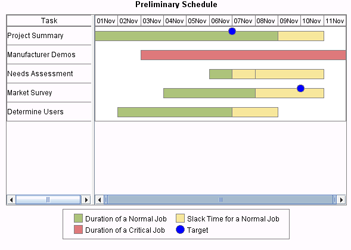
A GanttChartModel can show target dates on the Gantt chart to flag significant dates within the schedule. The target dates are defined in the data and added to the chart by the GanttChartTableDataModel.
The default marker style for target dates depends on the assigned graph style. For the GANTTCHART style, it is a flag. You can use the GanttChartModel to change that marker style. For example, you can change the marker to a filled blue circle.
To change the style for the markers that flag target dates,
GanttChartModel.getDataElementStyles().
DataElementStyles.getTargetMarkerStyle() to get the MarkerStyle
for the data elements.
The following code fragment changes the marker symbol to a filled blue circle with a size of 14 points:
// Get the chart's data elements and change the marker style for target dates
   GanttChartModel ganttChartModel = ganttChart.getGraphModel();
   MarkerStyle gMarkers = ganttChartModel.getDataElementStyles().getTargetMarkerStyle();
     gMarkers.setSymbol(MarkerStyle.SYMBOL_CIRCLE_FILLED);
     gMarkers.setSize(new BaseLength(14, "pt"));
     gMarkers.setColor(Color.blue);
The defined marker style is used for displaying target dates if the GanttChartTableDataModel assigns the Target variable role to a variable in the data.
A GanttChartModel can be used to modify the line style (color, width, visibility, ...) of any of the various lines in a GanttChart.
The following table shows the lines you can set and the method(s) to call to access and/or set the line attributes.
| To change ... | Call ... |
|---|---|
| Gantt bar outlines | getDataElementStyles().setOutlineLineStyle(LineStyle) |
| date axis lines | getDateAxisModel() and use the returned AxisModel to set axis line style |
| table axis lines | getTableAxisModel() and use the returned AxisModel to set axis line style |
| legend frame | getLegendModel().setFrameLineStyle(LineStyle) |
The following code fragment specifies a 3-point blue line for Gantt bar outlines:
GanttChartModel graphModel=ganttChart.getGraphModel();

LineStyle lineStyle=new LineStyle(
          java.awt.Color.blue,
          new com.sas.measures.BaseLength(3, "pt"),
          com.sas.components.GraphConstants.TRUE);

graphModel.getDataElementStyles().setOutlineLineStyle(lineStyle);
A GanttChartModel can set a fill style for highlighting weekends throughout the schedule. The fill is displayed in the background area within the weekend date ranges.
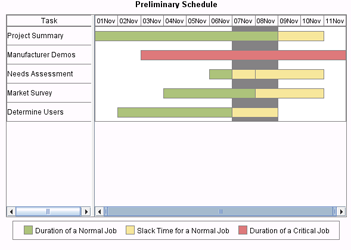
To show a background fill for weekends, call the GanttChartModel's getDateAxisModel() method and then use the returned CompoundTimeAxisModel to call getWeekendBandFillStyle() and set the fill attributes on the FillStyle that is returned.
The following code fragment sets a solid gray fill for weekends:
GanttChartModel ganttChartModel = ganttChart.getGraphModel();
CompoundTimeAxisModel dateAxis = ganttChartModel.getDateAxisModel();
FillStyle fill = dateAxis.getWeekendBandFillStyle();
fill.setFillType(FillStyle.FILL_TYPE_SOLID_COLOR);
fill.setSolidFillColor(Color.gray);
fill.setVisible(true);
A GanttChartModel can set the text attributes of annotation labels that have been set in the data model. To set these text attributes, call the GanttChartModel's getAnnotationLabelTextStyle() method and set the attributes on the TextStyle that is returned.
The following code fragment sets 12 point, bolded, Helv text with cyan color:
// Create a Font with the desired attributes
   Font font = new Font("Helv", Font.BOLD, 12);

// Set the font attributes on the Annotation Label text
   GanttChartModel ganttChartModel = ganttChart.getGraphModel();
   ganttChartModel.getAnnotationLabelTextStyle().setFont(font);
   ganttChartModel.getAnnotationLabelTextStyle().setColor(Color.cyan);
Note. Color values for the label text can be stored in the data and set by the data model (either a GanttChartTableDataModel or a GanttChartAnnotationTableDataModel). Color values that are set by the data model take precedence over color values that are set by the GanttChartModel.
GanttChartModel properties are bound properties. Modifying a property triggers a PropertyChangeEvent. The GanttChart asynchronously updates when a PropertyChangeEvent is received from the GanttChartModel. Similarly, modifying a property in any of the GanttChartModel's contained models triggers a PropertyChangeEvent. A PropertyChangeEvent from contained models will bubble up to cause a PropertyChangeEvent to be fired from the GanttChartModel.
For example, the following call
ganttChartModel.getLegendModel().getValueTextStyle().setColor(java.awt.Color.yellow);
would cause the legend's value text style model to fire a "color" PropertyChangeEvent, causing legend model to fire a "valueTextStyle" PropertyChangeEvent, causing the GanttChartModel to fire a "colorLegendModel" PropertyChangeEvent. This bubbling up of events enables the graph or any other listener to manage updates at a higher level of containment.