
The main responsibility of a LinePlotTableDataModel is to determine which data variables are used in the line plot and what role each variable plays. The primary roles are
Each of these primary roles are assigned to a PlotVariable. A unique plot point is produced for each unique X,Y value pair or combination of value pairs when other variable roles are specified, and by default those points are joined by an interpolated line.
The following code fragment assigs the X and Y variable roles to variables named x1 and y1:
// Create a data source
   javax.swing.table.TableModel dataTable = <...>;

// Create a data model and attach the data source to it
   LinePlotTableDataModel dataModel =
          new LinePlotTableDataModel();
   dataModel.setModel(dataTable);

// Assign the X and Y variable roles. Assignments
// assume that the data source contains a column
// named x1 and a column named y1.
   dataModel.setXVariable(new PlotVariable("x1"));
   dataModel.setYVariable(new PlotVariable("y1"));

// Create a LinePlot and attach the data model to it
   LinePlot linePlot = new LinePlot();
   linePlot.setDataModel(dataModel);
By default, plot markers are disabled and an interpolated line that joins plot points is displayed. To display plot markers instead of an interpolation line, get the plot's LinePlotModel and use it to
The LinePlotTableDataModel's ColorVariable role can be used to control the color of the markers in any LinePlot. This role is assigned to a data column that is used to create a Variable in the program code. In the following code fragment, CMarker is a data column that must store valid color values:
dataModel.setColorVariable(new Variable("CMarker"));
As an alternative to using a variable role to change plot markers, you can use a plot's LinePlotModel to
To label plot points above or below the plot points on the interpolated line, use the TopMarkerLabelVariable or BottomMarkerLabelVariable role.
Either of these variable roles can be assigned to a data column that is used to create a Variable in the program code. In the following code fragment, the values from a data column named y2 are used to label plot points above the plot points:
dataModel.setTopMarkerLabelVariable(new Variable("y2"));
To generate separate plot lines according to the values of a ClassificationVariable, assign the GroupVariable role to the appropriate classification variable.
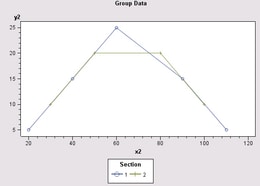
For example, a variable named Section might be assigned the Group role so that separate plot lines are generated for different sections that are tracked in the source data. The assignment would resemble the following:
dataModel.setGroupVariable(new ClassificationVariable("Section"));
Different colored lines are used to represent the values of the Group variable.
To fill the areas between plot lines, use a LinePlotModel to call the setFillAreaEnabled() method with the argument value true.
To use high and low values in a line plot, for example, when graphing stock market data or error values, specify multiple data columns on the PlotVariable(s) used in the plot.
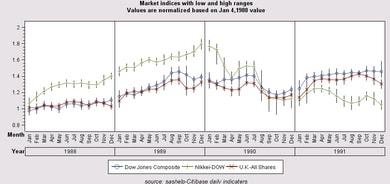
The PlotVariable constructor allows a null specification for either the high or low values. The constructor also has parameters for specifying value labels.
The following code fragment creates a new PlotVariable that uses variable Dow in the Y variable role, Dow-high for the high values, and Dow-low for the low values.
PlotVariable DowJones=new PlotVariable(
  "Dow"                  // column for Y role
 , "#.00"                // format
 , null                  // informat
 , "Dow Jones Composite" // label
 , "Dow-high"            // highColumnName
 , "Dow High"            // highLabel
 , "Dow-low"             // lowColumnName
 , "Dow Low"             // lowLabel
 );
dataModel.setYVariable(DowJones);
Multiple X and/or Y variables can be plotted on the same axes by adding the variables to an PlotVariableList, and then assigning that list rather than an individual variable to the X and/or Y role.
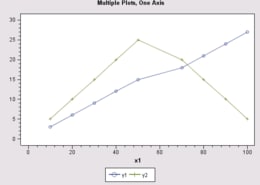
The following code fragment assigns the X role to variable X1, and the Y role to variables named Y1 and Y2:
dataModel.setPlotVariable(
  new ClassificationVariable("X1"));

PlotVariableList multiY=new PlotVariableList(
  new PlotVariable[] {
      new PlotVariable("Y1"),
      new PlotVariable("Y2")
  } );
dataModel.setYVariable(multiY);
For each value of the X variable, a plot point is generated for each Y variable's corresponding values.
A set of distinct plots can be generated for different X, Y variable pairs by specifying lists for both the X and Y variable roles as follows:
PlotVariableList multiX=new PlotVariableList(
  new PlotVariable[] {
      new PlotVariable("x1"),
      new PlotVariable("x2"),
      new PlotVariable("x3")
  } );

PlotVariableList multiY=new PlotVariableList(
  new PlotVariable[] {
      new PlotVariable("y1"),
      new PlotVariable("y2"),
      new PlotVariable("y3")
  } );

dataModel.setXVariable(multiX);
dataModel.setYVariable(multiY);
In this example, there will be three lines: one line for (x1, y1), another for (x2, y2), and a third for (x3, y3). With multiple variables assigned X and/or Y roles, all plot lines use the same set of axes.
If multiple variables are assigned the X role or the Y role, a separate plot line is generated for each variable. If X and Y both have multiple variables, then a line is produced for each pair of X and Y values. If a group variable is specified, different colored lines are used for each plot generated by the group values.
In all cases, because all plot lines use the same set of axes, you must be certain that the variables along each axis can be represented by the same value scale. When multiple X variables are specified, there must be a Y variable for each X. One of the Y variables can be assigned the Y2 role rather than the Y role.
Separate LinePlots can be generated for each value of a ClassificationVariable by assigning either the ColumnVariable or RowVariable role to that variable.
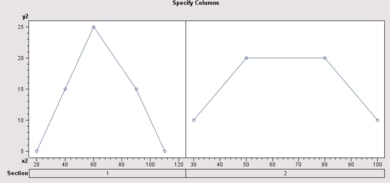
For example, if the data contain a categorical variable named Section, that variable might be assigned the Column role so that a separate plot is generated for each value of Section. The assignment would resemble the following:
dataModel.setColumnVariable(new ClassificationVariable("Section"));
If the Column role is assigned, plots are aligned horizontally by the variable's values. Each column has its own X axis scale, and the plots share the same Y axis and also Y2 axis, when present.
If the Row role is assigned, plots are aligned vertically by the variable's values. Each row has its own Y axis scale and, if the Y2 role is used, Y2 axis scale. The plots share the same X axis.
The Column and Row variable roles can both be assigned to the same graph. In that case, a separate line plot is produced for each unique pair of (column, row) values, and the plots are displayed in a grid.
The following table summarizes the LinePlotTableDataModel variable roles and the type of data each role supports.
| Variable Role | Class Type | Numeric | String | Multiple Variables |
|---|---|---|---|---|
| XVariable* Assigns horizontal-axis variable |
PlotVariable | Yes | Yes | Yes |
| YVariable* Assigns left vertical-axis variable |
PlotVariable | Yes | Yes | Yes |
| Y2Variable Assigns right vertical-axis variable |
PlotVariable | Yes | Yes | Yes |
| GroupVariable Generates a separate plot for each value of the group variable |
ClassificationVariable | No | Yes | No |
| ColorVariable Assigns marker colors |
Variable | Yes | Yes | No |
| SortVariable Determines the variable that will define the order in which the plot points are connected when a line interpolation is applied |
Variable | No | Yes | No |
| StyleVariable Sets the data column(s) in the attached TableModel whose values are to be used to determine the style of the lines and shapes of the markers |
ClassificationVariable | No | Yes | No |
| TopMarkerLabelVariable Displays plot-point labels above markers |
Variable | Yes | Yes | No |
| BottomMarkerLabelVariable Displays plot-point labels below markers |
Variable | Yes | Yes | No |
| ColumnVariable Aligns multiple plots in columns |
ClassificationVariable | Yes | Yes | Yes |
| RowVariable Aligns multiple plots in rows |
ClassificationVariable | Yes | Yes | Yes |
| * required variable | ||||
To generate a graph, a LinePlot needs data columns for the X and Y variable roles.
If the X role is not assigned in the program code, a LinePlot selects the first numeric column found in the LinePlotTableDataModel and uses it as its X variable. If there is no numeric column in the data, then it selects the first string column.
If the Y role is not assigned in the program code, a LinePlot selects the first numeric column that is different from X and uses it as the Y variable. If no valid numeric column is found, then it selects the first string column different from X and uses it as Y.
This default behavior occurs only when the X and/or Y role is not assigned. If either role is assigned to a variable that does not exist in the data, the LinePlot cannot display a graph.
A LinePlotTableDataModel fires property change events when
For example, if the name property is changed in the PlotVariable that has been assigned the XVariable role, the LinePlotTableDataModel fires a ProeprtyChangeEvent stating that the XVariable has changed.
When variable roles are assigned, the LinePlotTableDataModel does not confirm that the variables exist in the TableModel. Thus, assigning a non-existent data column to a variable role may mean that the LinePlot cannot display a graph. For example, if the XVariable role is assigned to a Month column but the TableModel does not contain a Month column, then the LinePlot fails to produce a graph.
If the XVariable and YVariable roles are correctly assiged to existing variables but another role is incorrectly assigned, the LinePlot displays a graph without the incorrect role. For example, if the XVariable and YVariable roles are correctly assigned but the ColumnVariable role is not, a graph using the X and Y roles is generated, but the Column role is ignored.