<%// BasicRequirements:%>
<%
// Basic requirements for creating a line plot in a JSP page:
// 1) Create a LinePlot instance and a data-source
// 2) Create a data model and attach the data source to it
// 3) Assign the X variable role, and optionally the
// Y variable role, to appropriate variable(s)
// 4) Assign the data model to the LinePlot
// 5) Set HTTP-specific response and request functionality
// To set a title or footnote, get the appropriate LinePlot
// title or footnote, and then set the returned object's text.
%>
<%@page import="com.sas.models.SimpleTable,
com.sas.swing.models.TableModelAdapter,
com.sas.servlet.tbeans.graphics.html.LinePlot,
com.sas.graphics.components.lineplot.LinePlotTableDataModel,
com.sas.graphics.components.PlotVariable"
%>
<%
// 1) Create a LinePlot instance
LinePlot linePlot = new LinePlot();
// Create a simple SAS table and add data to it
SimpleTable table = new SimpleTable();
%>
<%@ include file="TestData.jsp" %>
<%
// Convert a simple SAS table to a simple Java Swing table
TableModelAdapter tma = new TableModelAdapter(table);
tma.setFormattedDataUsed(false);
// 2) Create a data model and attach the data source to it
LinePlotTableDataModel linePlotDataModel=
new LinePlotTableDataModel(tma);
// 3) Assign the X and Y variable roles
linePlotDataModel.setXVariable(
new PlotVariable("x2"));
linePlotDataModel.setYVariable(
new PlotVariable("y2"));
// 4) Assign the data model to the LinePlot
linePlot.setDataModel(linePlotDataModel);
// Set a title
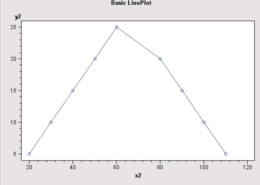
linePlot.getTitle1().setText("Basic LinePlot");
// 5) Set HTTP-specific response and request functionality
linePlot.setResponse(response);
linePlot.setRequest(request);
// Write the chart to the display
linePlot.write(out);
%>