Usage Note 40712: Changing font style properties for data values displayed on graphs in SAS® Web Report Studio
 |  |  |
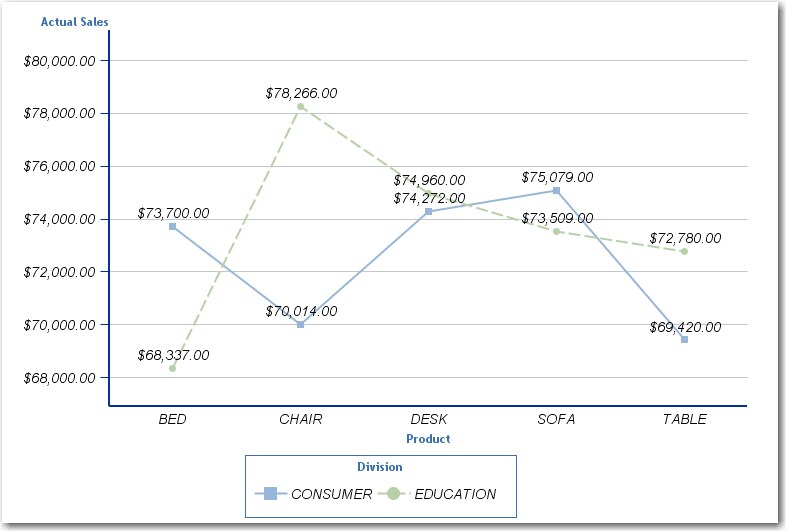
In SAS Web Report Studio, you have the option to display data values associated with lines, bars, markers, and segments used in graphs. Here is an example of a line graph with displayed data values.

You cannot modify the font properties of the data values by using the Properties dialog box for the graph. However, you can modify the properties by using a custom style sheet, keeping in mind the limitations listed next. This note explains the steps.
Note: These instructions work best with release 3.1. If you are using 4.2 or later and the styles are not applied as expected, see Problem Note 41739: SAS Web Report Studio 4.2 and later might not correctly apply custom style sheets.
Limitations
- Style modifications affect legend values and axis values in addition to the data values. Axis values can be manually modified using the Properties dialog box for the graph, but legend values cannot be changed.
- The size of the data values might be constrained by other graph properties. For example, if your bar chart contains subgroups, the data values are sized based on the size of the bars that they are associated with.
Modify the style
- Create a custom style sheet for the release of SAS Web Report Studio that you are using.
- Open your custom style sheet in a text editor and look for this section:
- Change the font-size value (and any other listed property) according to your preference. Here is an example of modified font-size, font-family, and font-style properties:
- Save the file.
- Restart your web application server.
For instructions, see the "Customizing Report Styles" topic in the SAS® Intelligence Platform: Web Application Administration Guide. For links to all of the available documentation for the SAS® Enterprise BI Server software products, see the SAS® Intelligence Platform page.
Graph ValueText
{
    text-color: #000000;
    font-size: 12pt;
    font-family: Arial;
    font-weight: normal;
    font-style: normal;
}
|
Graph ValueText
{
	text-color: #000000;
	font-size: 14pt;
	font-family: Helvetica, Arial;
	font-weight: normal;
	font-style: italic;
}
|
Apply the style
- In SAS Web Report Studio, open a report that contains a graph.
- Select File ► Properties, and click the Formats tab.
- From the Report style list, select your custom style sheet.
- Click OK to apply the style and display the report.
Here is an example of what the previously shown line graph looks like with the new font properties. On the graph, the axis values, legend values, and the data values use the new style. You can manually change the axis values by using the Properties dialog box for the graph. The data values and legend values will still use the settings from the style sheet.
Operating System and Release Information
| Product Family | Product | System | Product Release | SAS Release | ||
| Reported | Fixed* | Reported | Fixed* | |||
| SAS System | SAS Web Report Studio | Microsoft Windows 2000 Advanced Server | 3.1 | 9.1 TS1M3 SP4 | ||
| Microsoft Windows 2000 Datacenter Server | 3.1 | 9.1 TS1M3 SP4 | ||||
| Microsoft Windows 2000 Server | 3.1 | 9.1 TS1M3 SP4 | ||||
| Microsoft Windows 2000 Professional | 3.1 | 9.1 TS1M3 SP4 | ||||
| Microsoft Windows NT Workstation | 3.1 | 9.1 TS1M3 SP4 | ||||
| Microsoft Windows Server 2003 Datacenter Edition | 3.1 | 9.1 TS1M3 SP4 | ||||
| Microsoft Windows Server 2003 Enterprise Edition | 3.1 | 9.1 TS1M3 SP4 | ||||
| Microsoft Windows Server 2003 Standard Edition | 3.1 | 9.1 TS1M3 SP4 | ||||
| Microsoft Windows XP Professional | 3.1 | 9.1 TS1M3 SP4 | ||||
| Windows Vista | 3.1 | 9.1 TS1M3 SP4 | ||||
| Windows Vista for x64 | 3.1 | 9.1 TS1M3 SP4 | ||||
| 64-bit Enabled AIX | 3.1 | 9.1 TS1M3 SP4 | ||||
| 64-bit Enabled Solaris | 3.1 | 9.1 TS1M3 SP4 | ||||
| HP-UX IPF | 3.1 | 9.1 TS1M3 SP4 | ||||
| Type: | Usage Note |
| Priority: |
| Date Modified: | 2010-08-27 13:07:21 |
| Date Created: | 2010-08-27 12:15:32 |