DataFlux Data Management Studio 2.5: User Guide
Creating a Data Monitoring Job
Overview
You can create jobs that enable you to monitor data quality. For example, you can create a business rule that tracks the profit per employee against assets over time. Then, you could so specify the rule in a Business Rule node, or you could link the business rule to a task. When you add the Business Rule node or task to a monitoring job and run the job, you trigger input to the Monitor pane in the Information riser bar.
You can add a layer of organization to this scenario by creating a dashboard and a dimension. For example, suppose that you want to monitor various kinds of financial measures, and you would like to view them in a dashboard that is available in the Monitor Viewer in DataFlux Data Management Studio. You could begin by performing the following tasks:
- Create a dashboard called Fiscal. This custom dashboard would display a set of dimensions and their rules that are related to financial measurements. For more information, see Creating Dashboards, Dimensions, and Thresholds.
- Create a dimension called Profit. This dimension would contain a set of rules that measure profit. For more information, see Creating Dashboards, Dimensions, and Thresholds.
- Create a rule called ProfitEmp_LessThan_Assets. This rule would identify all records in a table where the profits per employee are less than the assets. For more information, see Creating a Rule that Compares Two Fields.
- Create a task called Fiscal_Profit_Log_to_Repos. This task would log exceptions to a DataFlux repository, where they could serve as input to the Dashboard and the Monitor Viewer in DataFlux Data Management Studio. This task would be associated with the ProfitEmp_LessThan_Assets rule, and this rule would be linked to the Profit dimension. For more information, see Creating a Rule that Compares Two Fields.
- Create a data monitoring job called Monitor Profit Per Employee. This job would apply the Fiscal_Profit_Log_to_Repos task to a data source. The exceptions to the rule would be logged to a DataFlux repository. For more information, see the steps below.
Perform the following tasks to create and review a data monitoring job:
Identify an Appropriate Business Rule and Task
For the current example, identify a business rule and task that will report the conditions that you want to monitor. The example uses the business rule and task that are described in Creating a Rule that Compares Two Fields. (Alternatively, you could specify the rule in a Business Rule node, as described in Using the Execute Business Rule Node.)
Create and Configure the Job
The goal in this section is to create a data monitoring job with a flow that looks similar to the next figure:
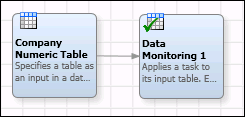
In the previous figure, Company Numeric Table is a data source. Data Monitoring 1 is a Data Monitoring node. The Data Monitoring node will apply a task (and business rule) to the data source and write any exceptions to the current repository. Perform the following steps to create and configure the job:
- Create a data job and give it an appropriate name, such as Monitor Profit Per Employee.
- Open the job.
- Add a Data Source node from the Data Inputs folder in the Nodes tree to the data flow.
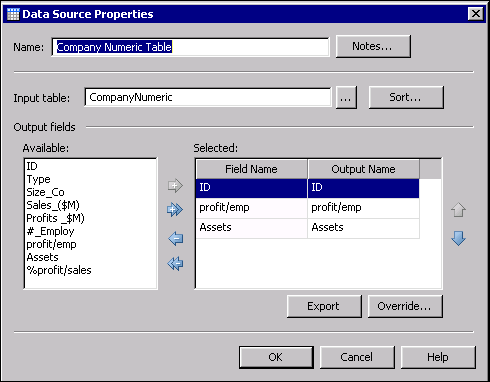
- Double-click the Data Source node to display its properties dialog.
- Specify an appropriate input in the Input table field. For this example, the input is the CompanyNumeric table that is available from the DataFlux Sample DSN connection.
- Rename the Data Source node to reflect the name of the input table (CompanyNumeric Table, for example).
- Specify the desired output fields from the input table. These outputs reflect the fields from the business rule (and task) that you will associate with the job. The completed configuration for the sample data source is shown in the following display:
- Click OK to save your settings.
- Add a Data Monitoring node from the Data Inputs folder in the Nodes tree to the data flow.
- Connect the Company Numeric Table input node to the Data Monitoring node.
- Double-click the Data Monitoring node to display its properties dialog.
- Select a previously created task in the Task name field. This task associates the job with the business rule that performs the data monitoring functions in the job. For the current example, you would select the task Fiscal_Profit_Log_to_Repos.
- Review the fields listed in the Input area. Map the field aliases in the business rule (task) to the physical fields in the data source. For the current example, the dialog for the node would look similar to the following:
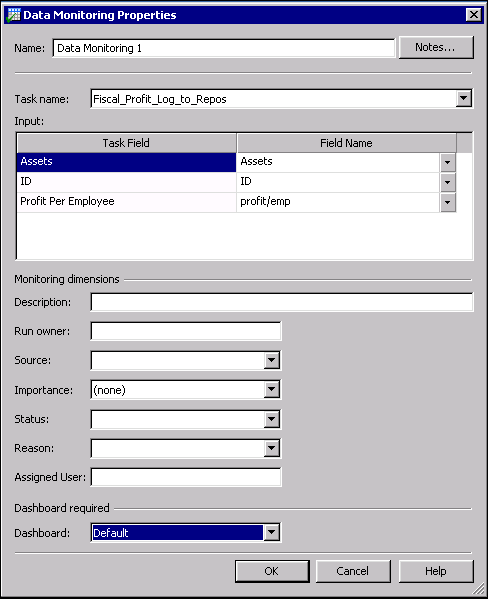
- The next task is to select a dashboard and enter some other attributes in the Monitor dimensions section of the dialog. For the current example, you would select the Fiscal dashboard in the Dashboard field.
- In the Description field, enter a description which indicates what the node is doing, such as: "Identifies records where profits per employee are less than the assets."
- In the Run owner field, type the user ID of the person who is responsible for the job.
- For now, skip the other fields in the Monitor dimensions section of the dialog. These fields are used to address problems that might be identified after the job is run.
- Click OK to save your settings.
Run the Job
Perform the following steps to run the job:
- Click Show Details Pane, if needed, to view the Log tab for the data job.
- Click Run Data Job to run the job.
- Review the log to make sure that all of the nodes in the data job have completed successfully.
Review Data Monitoring Results
See Using the Summary Tab and Dashboard Tabs and Using the Monitor Viewer.
|
Documentation Feedback: yourturn@sas.com
Note: Always include the Doc ID when providing documentation feedback.
|
Doc ID: dfU_T_DataJob_Monitor.html
|