DataFlux Data Management Studio 2.5: User Guide
The Monitor Viewer collects information about the data in a selected dashboard in a repository and the business rules that monitor it. It provides a detailed, interactive view of the exceptions to monitored business rules. The exceptions are generated by data monitoring jobs that are created in DataFlux Data Management Studio. The output of these jobs can now be monitored outside of DataFlux Data Management Studio in DataFlux Web Studio.
Business users can use the Monitor Viewer to monitor data quality in DataFlux Data Management Studio. Administrative users can then review the very similar Monitor Viewer in DataFlux Web Studio and perform the detailed analyses needed to address any problem areas.
You can set filters that control the subset of the data that you can examine in the viewer and review the information from a variety of perspectives. Perform the following tasks to use the Monitor Viewer:
You can access the Monitor Viewer for a selected repository in the following ways:
Once you have displayed the Monitor Viewer for the repository, you can filter the data to select the dashboard within the repository that you need to examine.
You should consider filtering the amount of your repository data for performance reasons if it contains several hundred thousand records or more. You can also use the fields in the Filter pane of the Monitor Viewer to control the type of data displayed.
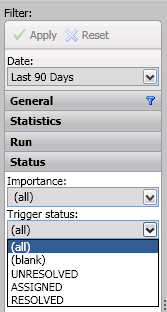
You can select a time frame in the Date field and drill-down into categories to set more specialized filtering criteria. For example, you can pick a trigger status from the Status category, as shown in the following display:
Note that a repository can have more than one dashboard. This feature enables you to create custom dashboards to perform specialized functions, such financial or system-performance monitoring and analysis. You can use the drop-down menu in the Dashboard field in the General section of the Filter pane to select the dashboard that you need.
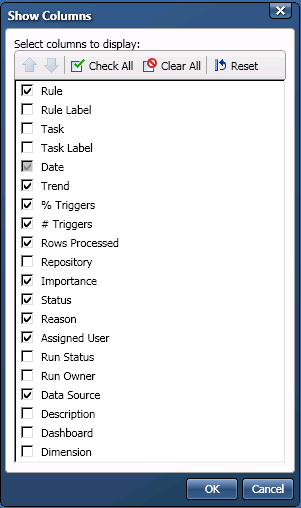
The business rules for the selected repository are displayed in the Triggered rules table. You can click Show Columns in the toolbar to select the columns displayed in the table. The Show Columns dialog is shown in the following display:
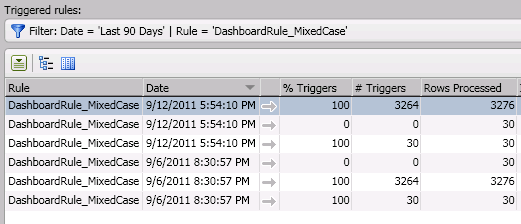
The Triggered rules table displays the business rules that remain after the filters in the Filter pane have been applied. The table is shown in the following display:
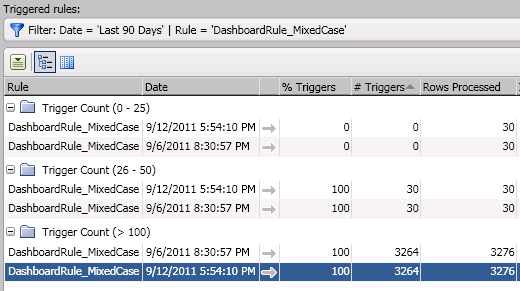
You can click the heading for any column to sort on the column. You can also select a column heading and click Show In Groups in the toolbar to see the rules grouped by the selected heading. The following display shows the rules grouped by the Trigger Count heading:
Now you can select a business rule and examine its components.
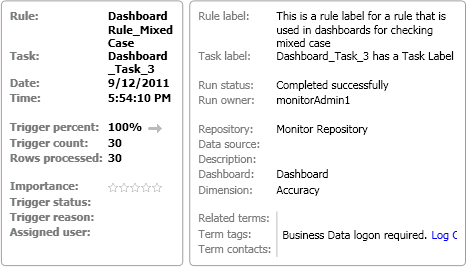
The Rules Tabs section of the Monitor Viewer enables you to review the selected rule in more depth by moving from one tab to the next. The Summary tab collects identification information and parameters for the selected rule, as shown in the following display:
The Trigger Values tab contains a list of the trigger values for the selected rule, along with a toolbar for moving values around the list, printing the list, and exporting the list. The Trigger Values tab is shown in the following display:

![]() Note: In order to see trigger values for a rule in the Monitor Viewer, the rule must specify a "Log error to repository" event. Otherwise the trigger values will not be written to the
repository and the Monitor Viewer cannot show them. For an example of how a "Log error to repository" event can be set, see Create a New Task and Associate it With the Rule.
Note: In order to see trigger values for a rule in the Monitor Viewer, the rule must specify a "Log error to repository" event. Otherwise the trigger values will not be written to the
repository and the Monitor Viewer cannot show them. For an example of how a "Log error to repository" event can be set, see Create a New Task and Associate it With the Rule.
The Rule Code tab displays the code for the selected rule, as shown in the following display:

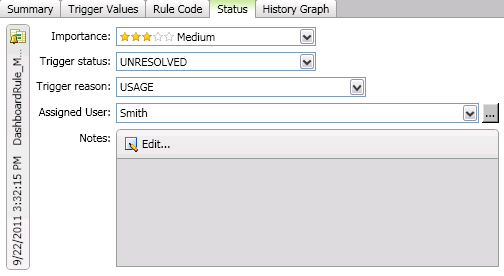
The Status tab enables you to review and modify status indicators for the selected rule. Therefore, you can use the tab to assign users, provide a reason for the trigger, and indicate how important it is. These metrics can be used to help prioritize work for individuals. The tab is shown in the following display:
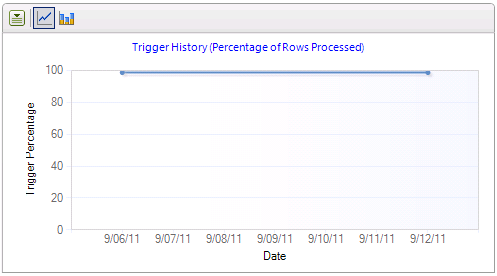
The History Graph tab displays trigger history for the selected rule, both by percentage of rows processed and trigger counts. The percentage of rows processed version is shown in the following display:
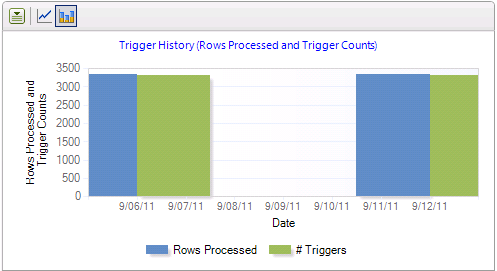
The trigger counts version is shown in the following display:
|
Documentation Feedback: yourturn@sas.com
|
Doc ID: dfDMStd_T_DataMon_MonViewer.html |