SAS® AppDev Studio™ 3.0 Developer's Site
Debugging a Web Application
Running and debugging a Web application is more involved than running a simple Java application or an applet. While a viewer can act as the container for executing an applet, a Web application needs a compliant web server to serve the web content, and a browser to initiate requests and display the responses. A pre-configured version of Tomcat provides the default web server for webAF. Menu commands make it easy to start the web server and to run the browser with the appropriate URL to access your web application. The webAF debugger can be used to set breakpoints and perform source level debugging of the servlets and java classes. It can even be used to debug the translated Java code generated when Java Server Pages are compiled into classes.
Running a Web application
To see a Web application run, you will first need to build the Web application.
The example below assumes you have already performed the steps in
Creating a New Web Application to create
a project named MyWebApp that has a single JSP file, index.jsp.
As created, this page does nothing. To make it do something that
will be visible in the browser when you run it, add the following lines at the
end of the index.jsp file and save it:
    <html>
    <head><title>MyWebApp</title></head>
    <body>
    <h3>My Web Application</h3>
    <p>The Server is running on port <%=request.getServerPort() %>
    </body>
    </html>
To run the Web application:
- In webAF, select Tools
![[arrow]](../../images/arrow.gif) Services
Start
Java Web Server. This will run
the current Web server. A new process will appear on the Windows task bar, named
Servlet 2.3/JSP 1.2 Web Server (assuming you are using the default webAF Web server).
Note: The web server will take a few seconds to initialize itself and serve the
Web application that you created, before it is ready to respond to requests.
Services
Start
Java Web Server. This will run
the current Web server. A new process will appear on the Windows task bar, named
Servlet 2.3/JSP 1.2 Web Server (assuming you are using the default webAF Web server).
Note: The web server will take a few seconds to initialize itself and serve the
Web application that you created, before it is ready to respond to requests. - Click the Execute in browser button in the webAF toolbar. After a few seconds the
browser should display the initial page of your Web application:
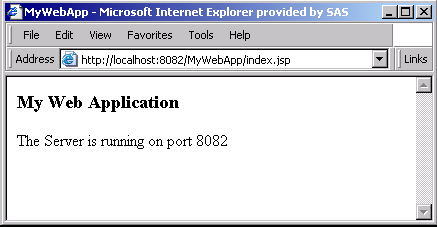
Note: If instead you see an HTTP error page ("The page cannot be displayed"), it is probably because you skipped step 1 above or did not wait long enough for the Web server to be ready. Try clicking the browser's Refresh button to correct the latter problem.
Note: The very first time a new or modified JSP page is accessed, it will take the Web server a few extra seconds to generate the response. This is because the JSP source code must be translated into Java source and compiled to generate its Java class. Subsequent requests for the same page will be much faster.
To Stop the Web server:
- In webAF, select Tools
Services
Stop
Java Web Server.
This will remove the server process from the Windows task bar. It is a good practice to
shut down the web server this way before exiting from webAF.
- You can close the browser window before or after stopping the Web server.
Re-starting the Web server after making changes in a Web application
When you rebuild your project (by selecting Build
![]() Project), webAF will automatically re-start
the Web server if it was already running, to ensure the most current classes are loaded.
It will not automatically start the Web server if it was not running, however.
Project), webAF will automatically re-start
the Web server if it was already running, to ensure the most current classes are loaded.
It will not automatically start the Web server if it was not running, however.
Since JSP files are re-compiled on the fly, and the webAF internal Tomcat server directly servers your project's files, you can save some time (especially in large projects) by not rebuilding after just making a simple change to a JSP file. For example, if you make a change to file index.jsp above, you can just save the file in webAF and then click the Refresh button on the browser to see the change take effect.
Debugging Servlets
The webAF debugger can be used to debug servlets, Java beans and other Java classes in a Web application in much the same way as for other types of Java projects.
To stop at a breakpoint in a servlet:
- In the source code editor for the servlet, set the breakpoint on the desired line as usual (F9 key).
- Select Debug
Go
to start the Web server in debug mode.
Wait a few seconds for the Web server to initialize and serve your Web application.
- Click the Execute in browser button in webAF to start the Web browser with the
default URL for your Web application.
Execution will pause at the specified line in your servlet. You can single step, examine variable values, or perform other debugger functions as usual.
To stop debugging a servlet:
- If the Web server is running and the debugger is not paused at a breakpoint,
the preferred way to halt is to select
Tools
Services
Stop
Java Web Server.
- If the Web server is not running (for example, because you are stopped
at a breakpoint and do not wish to continue running due to an error
in your Web application), select Debug
Quit
to stop the Web server. However this method
bypasses the server's normal cleanup during shutdown, so there might
be some adverse side affects.
You can close the browser window before or after stopping the Web server.
Debugging Java Server Pages
Debugging a JSP file is in some ways more challenging than debugging a servlet, because the Java "source" code does not exist until it is dynamically translated from the JSP file and then compiled into a class file by the Web server, and this does not happen until the first time the page is requested from the browser.
This is one reason why it is better to minimize the use of scriptlets in JSP code, and instead use tag libraries and/or Java beans to isolate program logic from the visual presentation in the JSP file.
If you make an error in a scriptlet or JSP expression that is detected during the translation of the JSP file, you will at least get a meaningful error message identifying the line number in your JSP file.
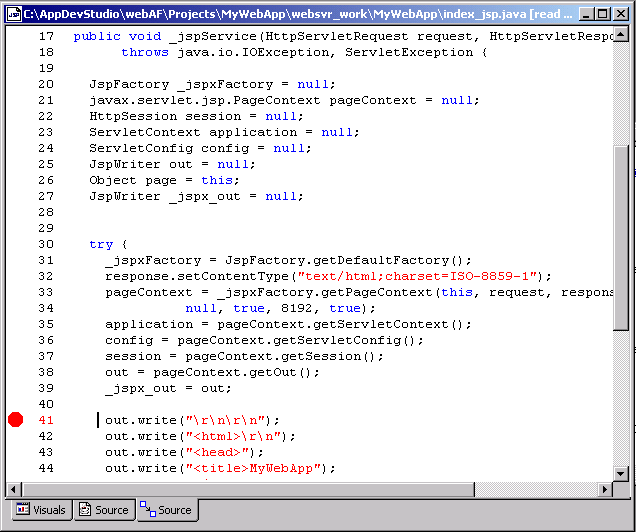
The webAF debugger can be used to set breakpoints in the translated Java source generated from JavaServer Pages. This source code will appear in the second source code tab of the editor, after the page has been initially requested from the browser:
There is a "chicken and egg" hurdle to overcome here though. What happens if you need to set a breakpoint in the translated source code before the page is executed the first time? You can use the following procedure to take advantage of a feature of the JSP 1.2 Specification, which defines a special URL parameter to cause the Web server to translate and compile the JSP file without outputting the response.
To force translation of a JSP file and to set a breakpoint:
- If the Java Web server is running, stop it by selecting
Tools
Services
Stop
Java Web Server.
- Click the Execute in browser button. This will fail with an HTTP error page, "The page cannot be displayed".
- In the Address box of the browser, edit the URL to include the desired
JSP page (if it is not the initial page), and add the special pre-defined query
parameter jsp_precompile, for example:
http://localhost:8082/MyWebApp/index.jsp?jsp_precompile - Select and copy this modified URL from the browser address to the clipboard using CTRL + C; then close the browser.
- In webAF, select Debug
Go
to start the Web browser in debug mode.
- Do not use the webAF command or button, but start your Web browser from Windows. Paste the saved URL from the clipboard into the Address of the browser and press Enter. This will trigger a compilation of the JSP page without executing it.
- After the browser displays an empty page, close the browser.
- In webAF, select the second Source editor tab for the desired JSP file. The translated java source code will now be present.
- Set a breakpoint at the desired location (F9 key).
- Click the webAF Execute in browser button, and if necessary use the browser to navigate to the desired page. The breakpoint will be hit in the webAF debugger, and you can use it as usual.
Exceptions and Error Pages
Providing one or more custom error pages for a Web application is a good practice, enabling you to customize your processing of exceptions in a manner appropriate to the nature of your application and its intended audience. For example, you might want to replace the default stack trace with a more "user-friendly" message, while preserving the stack trace in a log for subsequent investigation.
In the case of the Tomcat server integrated with webAF, you might want to specify an error page for another reason. By default, it displays the top-layer exception and one "root cause" exception message, if present. However with the many layers involved in Web applications, sometimes the initial trigger exception can be caught and re-thrown in a more general exception (for example, a javax.servlet.ServletException), which in turn can be caught again and re-thrown (for example, as a javax.servlet.jsp.JspException). When this happens, the actual triggering exception (for example, a null pointer exception) may not be displayed.
One possible approach to an error page is illustrated in the example below, myerror.jsp:
    <%@ page pageEncoding="UTF-8" isErrorPage="true" %>
    <html>
    <head><title>Error on Server</title></head>
    <body>
    <h2>An Error Occurred on the Server</h2>
    <p>
    The following error occurred during the request for:
    <strong><%= request.getAttribute("javax.servlet.error.request_uri") %></strong><br>
    <br>
    <%= exception.toString()%>
    </p>

    <p></p>
    <pre>
    <%
        java.io.PrintWriter pw = null;
        Throwable curException = exception;
        while (null != curException)
        {
            // send to console or server log
            curException.printStackTrace();

            // if debug mode, include stacktrace in the response
            if (null != application.getInitParameter("debug"))
            {
                if (null == pw)
                {
                    pw = new java.io.PrintWriter(out);
                    pw.println("<strong>Cause:</strong>");
                }
                curException.printStackTrace(pw);
            }

            // try to find nested cause, if present
            if (curException instanceof JspException)
            {
                Throwable ex = ((JspException)curException).getRootCause();
                if (ex != null)
                {
                    curException = ex;
                }
                else
                {
                    curException = curException.getCause();
                }
            }
            else if (curException instanceof ServletException)
            {
                Throwable ex = ((ServletException)curException).getRootCause();
                if (ex != null)
                {
                    curException = ex;
                }
                else
                {
                    curException = curException.getCause();
                }
            }
            else
            {
                curException = curException.getCause();
            }
            if (null != curException)
            {
                System.out.println("Which was caused by:");
                if (null != pw)
                {
                    pw.println("<strong>Which was caused by:</strong>");
                }
            }
        }
    %>
    </pre>
    </body>
    </html>
When invoked, this page normally displays only a brief general message naming the requested resource, and outputs the stack trace to the console. If the exception is a JspException or ServletException, then it recursively retrieves the root cause exception and outputs its stack trace to the console.
However, the Web application can be designated as being in "debug mode", in which case
each stack trace is also displayed as part of the response. Entries in the
web.xml file control whether or not the Web application is in "debug mode", and
what kind of exception(s) trigger the error page:
    <?xml version="1.0" encoding="ISO-8859-1"?>
    <!DOCTYPE web-app PUBLIC "-//Sun Microsystems, Inc.//DTD Web Application 2.3//EN"
         "http://java.sun.com/dtd/web-app_2_3.dtd">
    <web-app>

     <context-param>
      <param-name>debug</param-name>
      <param-value>true</param-value>
     </context-param>

     <error-page>
      <exception-type>
       java.lang.Exception
      </exception-type>
      <location>
       /myerror.jsp
      </location>
     </error-page>
    </web-app>
Here, "debug mode" is enabled by defining the value of the context parameter debug,
and the error page will be invoked for any un-caught descendents of java.lang.Exception.