T Tests Task: One-Sample t Test
About the One-Sample t Test Task
A one-sample t test
compares the mean of the sample to the null hypothesis mean.
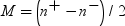
To compare an individual
mean with a sample size of n to a value m,
use  where
where  is the sample mean of the observations and s2 is
the sample variance of the observations.
is the sample mean of the observations and s2 is
the sample variance of the observations.
where is the sample mean of the observations and s2 is
the sample variance of the observations.
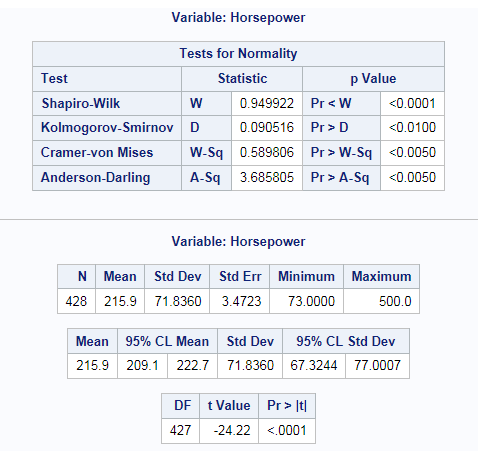
For example, you want
to perform a one-sample t test on the horsepower
values in the Sashelp.Cars data set. The null hypothesis is 300.
To run a one-sample t test,
open the T Tests task. From the T test drop-down
list,
select One-sample test.

Setting Options
|
Option Name
|
Description
|
|---|---|
|
Test
|
|
|
Tails
|
specifies the number
of sides (or tails) and direction of the statistical tests and test-based
confidence intervals. You can choose from these options:
|
|
Alternative
hypothesis
|
specifies the value
of the null hypothesis. By default, the null hypothesis has a value
of 0.
|
|
Normality Assumption
|
|
|
Tests for
normality
|
runs tests for normality
that include a series of goodness-of-fit tests based on the empirical
distribution function. The table provides test statistics and p-values
for the Shapiro-Wilk test (provided the sample size is less than or
equal to 2000), the Kolmogorov-Smirnov test, the Anderson-Darling
test, and the Cramér-von Mises test.
|
|
Nonparametric Tests
Note: This option is available
only for a two-tailed test.
|
|
|
Sign test
and Wilcoxon signed rank test
|
generates the results
from these tests:
|
|
Plots
|
|
|
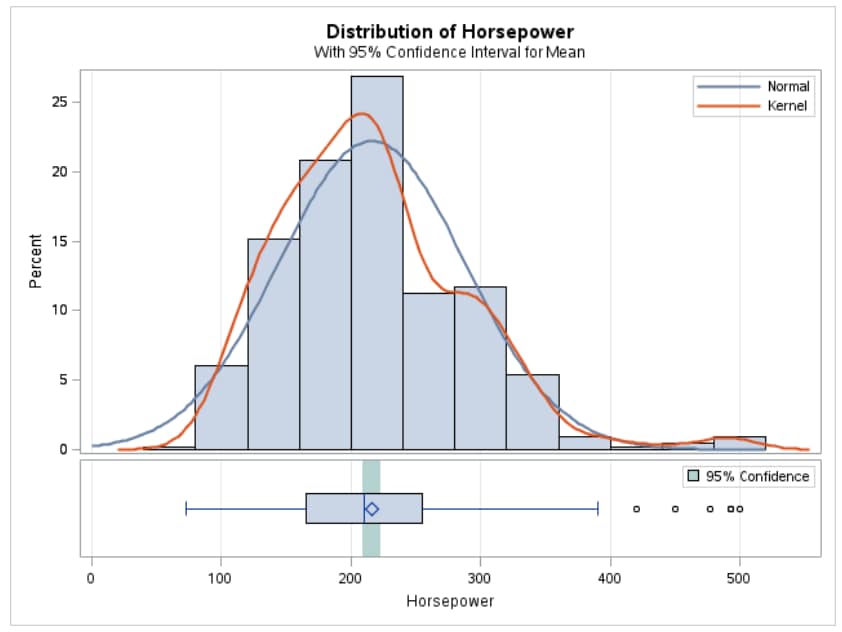
Histogram
and box plot
|
creates a histogram
and box plot together in a single panel, sharing common X axes.
|
|
Normality
plot
|
creates a normal quantile-quantile
(Q-Q) plot.
|
|
Confidence
interval plot
|
creates a plot of the
confidence interval for the means.
|


Copyright © SAS Institute Inc. All rights reserved.