Table Analysis Task

Assigning Data to Roles
To run the Table Analysis
task, you must first assign at least one column to the Row
variables or Column variables roles.
|
Roles
|
|
|---|---|
|
Roles
|
|
|
Row variables
|
specifies the row for
one-way table analysis. If multiple variables are assigned to this
role, the task performs multiple one-way table analyses.
|
|
Column variables
|
creates the columns
for one-way table analysis. If only column variables are assigned,
the task performs multiple one-way table analyses.
|
|
Strata variables
|
creates the separate
tables for n-way frequency and crosstabulation tables.
Note: You must assign columns to
both the Row variables or Column
variables roles to use a strata variable.
|
|
Additional Roles
|
|
|
Frequency
count
|
specifies that each
row in the table is assumed to represent n observations.
In this example, n is the value of the frequency
count for that observation.
|
Setting Options
|
Option Name
|
Description
|
|---|---|
|
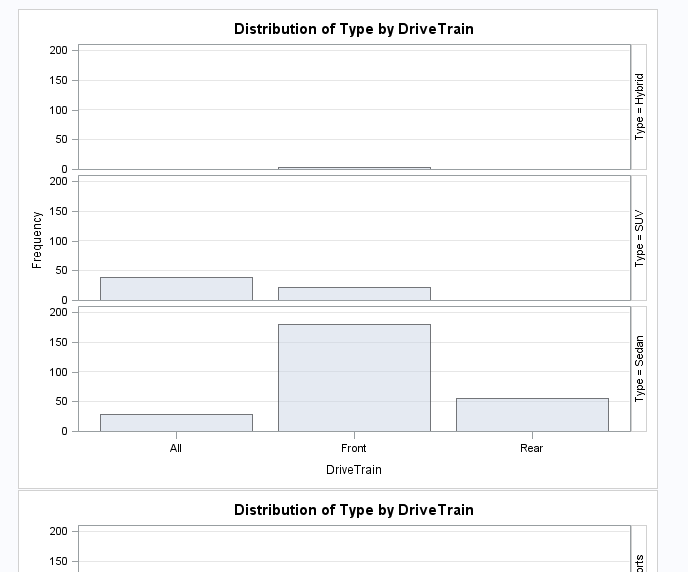
Plots
|
|
|
By default, plots are
included in the results. To suppress these plots, select the Suppress
plots check box.
|
|
|
Frequency Table
|
|
|
Frequencies
|
|
|
Observed
|
displays the frequency
count for each cell.
|
|
Expected
|
displays the expected
cell frequency for each cell.
|
|
Deviation
|
displays the deviation
of the cell frequency from the expected value for each cell.
|
|
Percentages
|
|
|
Cell
|
display of overall percentages
in crosstabulation tables.
|
|
Row
|
display of row percentages
in crosstabulation table cells.
|
|
Column
|
display of column percentages
in crosstabulation table cells.
|
|
Cumulative
|
|
|
Column percentages
|
displays the cumulative
column percentage in each cell.
|
|
Frequencies
and percentages
|
displays the cumulative
frequencies and percentages in one-way frequency tables.
|
|
Cell contributions
to the chi-square statistics
|
displays each table
cell’s contribution to the Pearson chi-square statistic in
the crosstabulation table.
|
|
Statistics
|
|
|
Chi-square
statistics
|
requests chi-square
tests of homogeneity or independence and measures of association that
are based on the chi-square statistic. The tests include the Pearson
chi-square, likelihood-ratio chi-square, and Mantel-Haenszel chi-square.
For 2×2 tables, this test includes Fisher's exact test and the
continuity-adjusted chi-square.
|
|
Measures
of association
|
computes several measures
of association and their asymptotic standard errors (ASE). The measures
include gamma, Kendall's tau-b, Stuart's tau-c,
Somers' D (C|R), Somers'
D (R|C), the Pearson
and Spearman correlation coefficients, lambda (symmetric and asymmetric),
and uncertainty coefficients (symmetric and asymmetric).
|
|
Cochran-Mantel-Haenszel
statistics
|
requests Cochran-Mantel-Haenszel
statistics, which test for association between the row and column
variables after adjusting for the remaining variables in a multiway
table. These statistics include the CMH correlation statistic, the
row mean scores (ANOVA), and the adjusted relative risks and odds
ratios.
|
|
Measures
of agreement (for square tables)
|
computes tests and measures
of classification agreement for square tables. This option provides
McNemar's test for 2×2 tables and Bowker's test of symmetry for
tables with more than two response categories. It also produces the
simple kappa coefficient, the weighted kappa coefficient, the asymptotic
standard errors for the simple and weighted kappas, and the corresponding
confidence limits. When there are multiple strata and two response
categories, this option also computes Cochran's Q test.
|
|
Odds ratio
and relative risk (for 2x2 tables)
|
requests relative risk
measures and their asymptotic Walk confidence limits for 2x2 tables.
|
|
Binomial
proportions and risk differences (for 2x2 tables)
|
requests risks (binomial
proportions) and risk differences for 2x2 tables.
|
|
Exact Test
|
|
|
Fisher’s
exact test
|
requests Fisher’s
exact test for tables that are larger than 2x2.
|
|
Methods
|
|
|
Missing
value treatment
|
specifies how to treat
missing values:
Exclude missing values
specifies that an observation
is excluded from a table if the observation has a missing value for
any of the variables.
Display missing value frequencies
displays the frequencies
of the missing values in the frequency and crosstabulation tables.
These frequencies are not included in any computations of percentages,
tests, or measures.
Include missing values in calculations
treats the missing
values as valid for all variables.
|
Copyright © SAS Institute Inc. All rights reserved.