One-Way Frequencies Task
About the One-Way Frequencies Task
The One-Way Frequencies
task generates frequency tables from your data. You can also use this
task to perform binomial and chi-square tests.
You might want to use
this task to analyze the efficiency of a new drug. For example, suppose
a group of medical researchers are interested in evaluating the efficacy
of a new treatment for a skin condition. Dermatologists from participating
clinics are trained to conduct the study and to evaluate the condition.
After the training, two dermatologists examine patients with the skin
condition from a pilot study and rate the same patients. The One-Way
Frequencies task can be used to evaluate the agreement of the diagnoses.
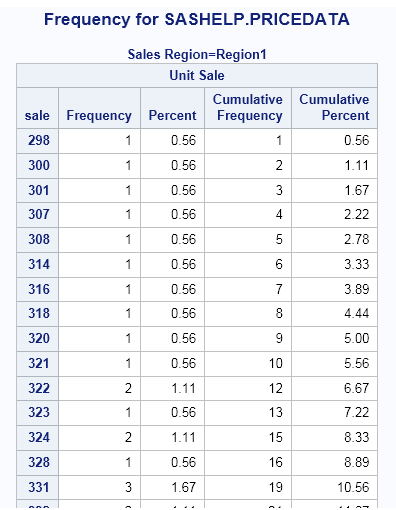
Example: One-Way Frequencies of Unit Sales

Assigning Data to Roles
To run the One-Way
Frequencies task, you must assign a column to the Analysis
variables role.
|
Role
|
Description
|
|---|---|
|
Roles
|
|
|
Analysis
variables
|
specifies the variables
to be analyzed. For each variable that you assign to this role, the
task creates a one-way frequency table. You must assign at least one
variable to this role.
|
|
Additional Roles
|
|
|
Frequency
count
|
specifies the variable
to use as the frequency count. When you assign a variable to this
role, each observation in the table is assumed to represent n observations.
In this example, n is the value of the frequency
count for that row. You can assign only one variable to this role.
|
|
Group analysis
by
|
specifies one or more
variables to sort the table by. Analyses are performed on each group.
|
Setting Options
|
Option Name
|
Description
|
|---|---|
|
Plots
|
|
|
By default, plots are
included in the results. Select the Show frequencies table check
box to create the frequency and cumulative frequency plots. Select
the Asymptotic test check box for the chi-square
goodness-of-fit to create the deviation plot.
To suppress the plots
from the results, select the Suppress plots check
box.
|
|
|
Frequencies and Percentages
|
|
|
Show frequencies
table
|
specifies whether to
create the frequencies table.
|
|
Include
percentages
|
creates a table that
contains the frequencies and percentages of total frequencies for
each value of the analysis variable.
|
|
Include
cumulative frequencies and percentages
|
creates a table that
contains the frequencies and cumulative frequencies for each value
of the analysis variable.
|
|
Statistics
|
|
|
Binomial Proportion
|
|
|
Specify whether to perform
an asymptotic test. For binomial proportions, specify a null hypothesis
proportion and a confidence level.
|
|
|
Chi-square goodness-of-fit
|
|
|
Specify whether to perform
an asymptotic test.
To compute the Monte
Carlo estimates of the exact p-values instead
of directly computing the exact p-values, select
the Use Monte Carlo estimation check box.
Monte Carlo estimation can be useful for large problems that require
a great amount of time and memory for exact computations but for which
asymptotic approximations might be insufficient.
|
|
|
Exact Computations Methods
Note: This section appears if you
select the Exact test check box for the binomial
proportion or chi-square goodness-of-fit statistics.
|
|
|
Limit computation
time
|
specifies the time limit
(in seconds) for the computation of each p-value
for each crosstabulation table. The default is 300 seconds (or 5 minutes).
|
|
Missing Values
|
|
|
Include
in frequency table
|
includes missing values
in the frequency tables.
|
|
Include
in percentages and statistics
|
includes the frequencies
of missing values in binomial or chi-square tests and in the calculations
of percentages.
|
Copyright © SAS Institute Inc. All rights reserved.