High-Performance Correlation Analysis Task
About the High-Performance Correlation Analysis Task
Correlation is a statistical
procedure for describing the relationship between numeric variables.
The relationship is described by calculating correlation coefficients
for the variables. The High-Performance Correlation Analysis task
computes Pearson statistics for investigating associations among variables.
Correlations range from –1 to 1.
Note: This task is available only
if you are running SAS 9.4 or later.
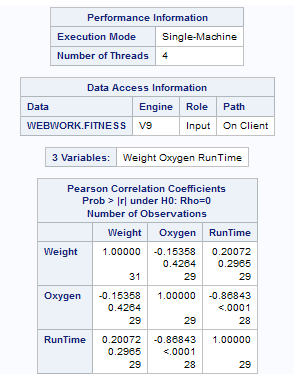
Example: Correlation between Weight, Oxygen, and Run Time
To create this example:
-
Create the Work.Fitness data set. For more information, see FITNESS Data set.

Assigning Data to Roles
To run the High-Performance
Correlation Analysis task, you must assign two columns to the Analysis
variables role.
|
Role
|
Description
|
|---|---|
|
Roles
|
|
|
Analysis
variables
|
specifies the columns
to use to calculate the correlation coefficients.
|
|
Additional Roles
|
|
|
Frequency
count
|
specifies a numeric
column whose value represents the frequency of the observation.
|
|
Weight
|
specifies the weights
to use in the calculation of Pearson weighted product-moment correlation.
|
Setting Options
|
Option Name
|
Description
|
|---|---|
|
Methods
|
|
|
Missing
values
|
specifies whether to
include missing values in the calculations.
|
|
Statistics
|
|
|
You can specify whether
the results include only the statistics that the task automatically
generates, the statistics that you selected, or no statistics. By
default, only the correlations table is displayed in the results.
You can include these
statistics in the results:
|
|
|
Display
p-values
|
specifies whether to
display for each correlation coefficient the probability of observing
a more extreme value than the observed coefficient.
|
|
Order correlations
from highest to lowest
|
displays the ordered
correlation coefficients for each variable. Correlations are ordered
from highest to lowest in absolute value.
|
Copyright © SAS Institute Inc. All rights reserved.