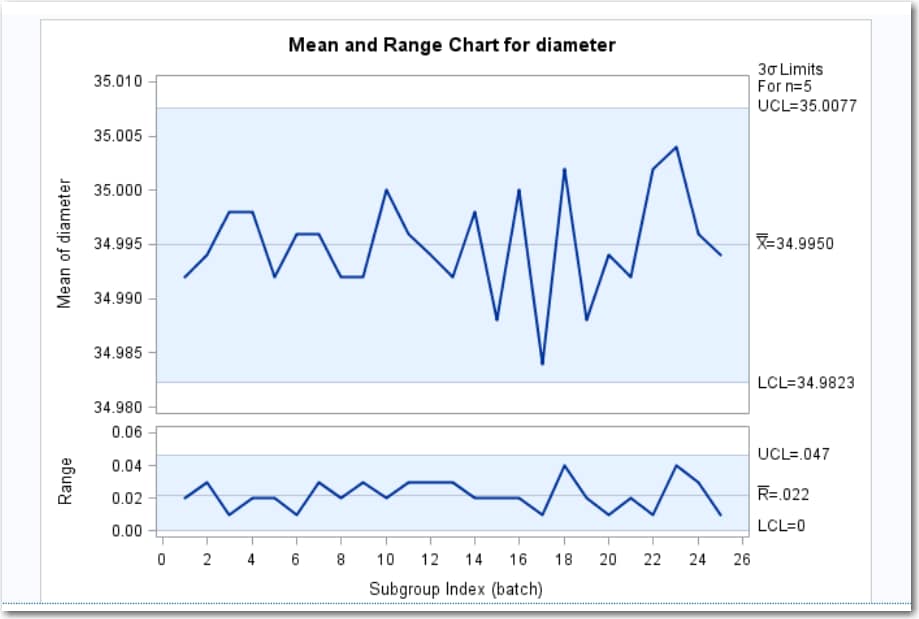
Example: Determine the Mean and Range for the Diameters of Wafers
To create this example:
-
Copy and paste this code into the Program tab.
data wafers;
   input batch @;
   do i=1 to 5;
      input diameter @;
      output;
   end;
   drop i;
   datalines;
1 35.00 34.99 34.99 34.98 35.00
2 35.01 34.99 34.99 34.98 35.00
3 34.99 35.00 35.00 35.00 35.00
4 35.01 35.00 34.99 34.99 35.00
5 35.00 34.99 34.98 34.99 35.00
6 34.99 34.99 35.00 35.00 35.00
7 35.01 34.98 35.00 35.00 34.99
8 35.00 35.00 34.99 34.98 34.99
9 34.99 34.98 34.98 35.01 35.00
10 34.99 35.00 35.01 34.99 35.01
11 35.01 35.00 35.00 34.98 34.99
12 34.99 34.99 35.00 34.98 35.01
13 35.01 34.99 34.98 34.99 34.99
14 35.00 35.00 34.99 35.01 34.99
15 34.98 34.99 34.99 34.98 35.00
16 34.99 35.00 35.00 35.01 35.00
17 34.98 34.98 34.99 34.99 34.98
18 35.01 35.02 35.00 34.98 35.00
19 34.99 34.98 35.00 34.99 34.98
20 34.99 35.00 35.00 34.99 34.99
21 35.00 34.99 34.99 34.98 35.00
22 35.00 35.00 35.01 35.00 35.00
23 35.02 35.00 34.98 35.02 35.00
24 35.00 35.00 34.99 35.01 34.98
25 34.99 34.99 34.99 35.00 35.00
run;
Click to create the Work.Wafers data set.
Copyright © SAS Institute Inc. All rights reserved.