Adding Graph-Level Display Rules
You can add display rules to graphs. Note that you
cannot create a display rule to highlight dates in a graph.
Add Display Rules to a Graph Using an Expression
Here are some key points
about adding an expression-based display rules to a graph:
-
Display rules can be added to a waterfall chart only if you clear the Color by response sign check box on the Properties tab in the right pane.
-
You can create an expression-based display rule for a 100% stacked bar chart, which uses the Grouping style and Grouping scale properties. However, the display rule cannot be based on a percentage.
To specify a new expression-based
display rule for a graph:
-
If it is not already selected, select the graph in the canvas that you want to update.
-
In the right pane, click the Display Rules tab. Click New. The Add New Display Rule window is displayed.
-
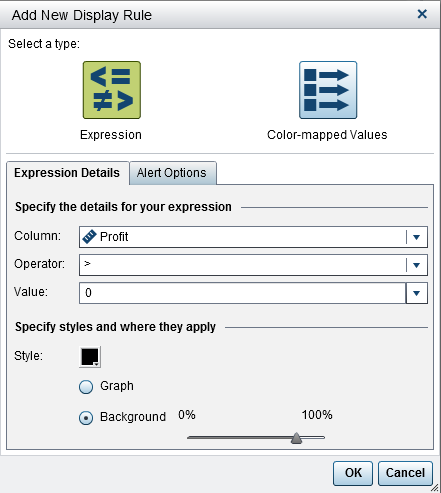
Click Expression. The Add New Display Rule window expands to show the details for the expression.
-
On the Expression Details tab, select the Column or any measure value.
-
Select the Operator. You can select =, < >, BetweenInclusive, <, <=, >, >=, Missing, or NotMissing. The default is >.
-
Enter or select a Value.
-
If your graph contains a hierarchy, then you can specify the hierarchy levels in which the display rule is applied.
-
Click Specify Intersections. The Specify Intersections window is displayed.
-
Select one or more hierarchy levels. Click OK to return to the Add New Display Rule window. The intersections that you selected are displayed above the Edit Intersections button.
-
-
Modify the Style, which includes color and graph or background.Note: Background is available only for bar charts, waterfall charts, line charts, scatter plots, time series plots, and bubble plots. It is also available for needle plots, which are created in the SAS Visual Analytics Graph Builder (the graph builder).
-
(Optional) On the Alert Options tab, select the Create an alert based on this rule check box. For more information about alerts, see Working with Alerts for Report Objects.
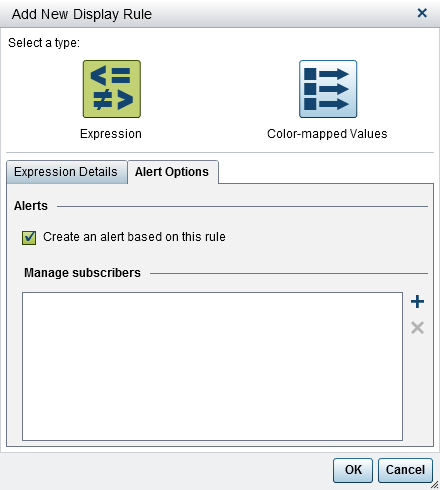 Use the Manage subscribers list to add users who you want notified when the alert condition is met.
 -
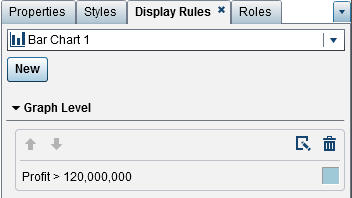
Click OK. The graph updates with the new display rule. The display rule appears on the Display Rules tab in the right pane.Here is an example of a display rule that uses an expression:
-
(Optional) Click
 on the Display Rules tab
to edit the new display rule.
on the Display Rules tab
to edit the new display rule.
Note: A warning badge is displayed
on a graph when the color is overloaded. This happens when multiple
measures are assigned, a color or group role is assigned, or multiple
overlays are present (which have cycling colors).
Add Display Rules to a Graph Using Color-Mapped Values
Note: Display rules can be added
to a waterfall chart only if you clear the Color by response
sign check box on the Properties tab
in the right pane.
To specify a new display
rule for a graph using color-mapped values:
-
If it is not already selected, select the graph in the canvas that you want to update.
-
In the right pane, click the Display Rules tab. Click New. The Add New Display Rule window is displayed.
-
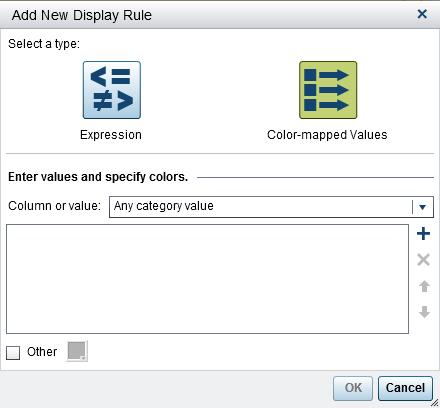
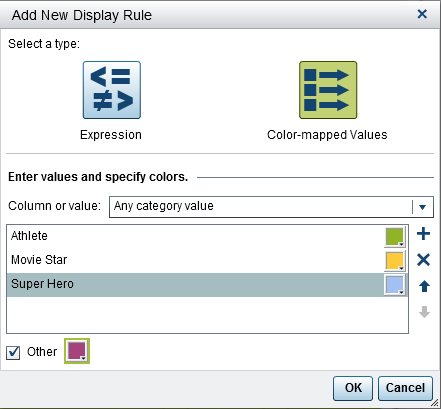
Click Color-mapped Values. The Add New Display Rule window expands to show the details for the color-mapped values.
-
Select the Column or value to which you want to apply the display rule.Note: Color-mapped values for a report object can be applied only to category data items.Note: Color-mapped values cannot be applied to date or datetime data items.
-
Click in the box to enter a value for the display rule.
-
Select a color for the display rule.
-
(Optional) Repeat the steps for entering a value and selecting a color.
-
(Optional) Select the Other check box. Then, select a color.
-
Using the list, specify where you want to apply the colors.In the following example, values and colors have been specified for products in a graph.
-
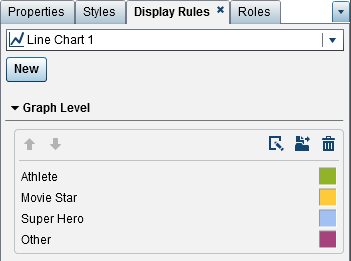
Click OK. The graph updates with the display rules.The display rule appears on the Display Rules tab in the right pane.
-
(Optional) Click
 on the Display Rules tab to change the graph-level display rule to a report-level display rule.
Copyright © SAS Institute Inc. All Rights Reserved.
Last updated: January 8, 2019