Working with Data Sources in Reports
About Data Sources
Many data sources that
are available in the designer are prepared by a data administrator
or analyst so that you can easily define a report. Data administrators
load tables into memory using SAS Visual Analytics Administrator (the
administrator). Analysts can use SAS Visual Data Builder (the builder)
to design queries that load tables into memory too.
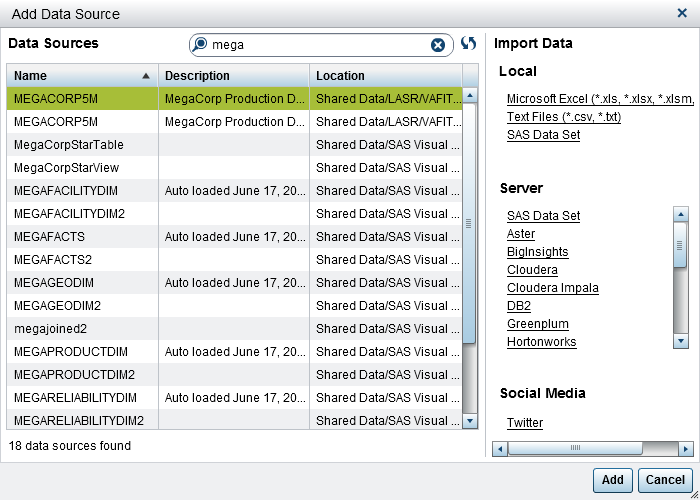
The Add
Data Source window can be used to add or import data
sources. If you have the Import and Load Data capability, then you
can import data from a file into the designer. Supported files are
SAS data sets, Microsoft Excel spreadsheets, and delimited text files
(such as CSV files). If you can import data sources, the Add
Data Source window has Import Data in
the right pane. For information
about exporting data, see
Exporting Data from Report Objects.
All data sources contain
data items, which can refer to calculations or columns in physical
data (tables). Reports can include query results from more than one
data source.
Import a Data Source for a Report
If you have the Import
and Load Data capability, then you can import a data source into the
designer using either the Add Data Source or
the Change Data Source window. When you import
data, the data source is automatically added to the open report. For a list of supported
files and more information about importing server data, see
Importing Local Data Files.
To import a data source
for a report using the Add Data Source window:
-
TipIf you select a delimited text file, then you can specify additional options. For example, you can specify the delimiter, whether the first row contains column heading names, and where the data rows begin.TipIf you select a spreadsheet, then you can specify additional options. For example, you can specify which worksheets to import, whether the first row contains column heading names, and where the data rows begin.

Add a Data Source to a Report
You can use one or more
data sources in a report in the designer.
To add a data source
to a report:
-
TipUse the Search field to narrow the list of data sources that are displayed in the Add Data Source window. The search searches the Name and Description fields. It is a “begins with” search rather than a “contains” search. If you receive a message that a data source is not available, contact your data administrator.
-
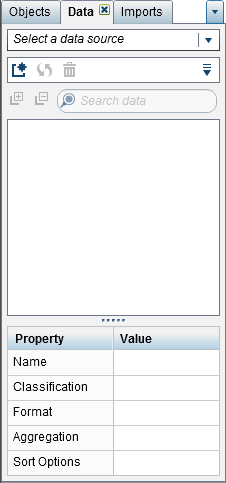
(Optional) To add additional data sources, click
 on the Data tab, which displays
the Add Data Source window. Select the data
sources that you want, and then click Add.
The Data tab is populated with a list of
all of the data items that are in the data sources.
When you add multiple data sources, the last data source that you selected is displayed on the Data tab. If one of the data sources that you selected is not available, the last available data source that you selected is displayed on the Data tab.Note: When you open a saved report that has multiple data sources, the designer displays the same data source that was displayed in the Data tab when the report was saved.
on the Data tab, which displays
the Add Data Source window. Select the data
sources that you want, and then click Add.
The Data tab is populated with a list of
all of the data items that are in the data sources.
When you add multiple data sources, the last data source that you selected is displayed on the Data tab. If one of the data sources that you selected is not available, the last available data source that you selected is displayed on the Data tab.Note: When you open a saved report that has multiple data sources, the designer displays the same data source that was displayed in the Data tab when the report was saved.
Refresh a Data Source for a Report
You can refresh the
columns in a data source in the designer at any time. Be aware that
refreshing a data source means that all live report objects that are
connected to that data source will have their queries rerun.
Note: Refreshing a data source
adds any new columns that have been added to the table metadata in
the SAS LASR Analytic Server. The default formats and names of existing
columns will be updated the next time you open the report.
Note: Data is refreshed from the
table that is currently loaded into the SAS LASR Analytic Server.
To refresh a data source
for a report, on the Data tab, select the
data source, and then click  .
.
.
To refresh the list
of data sources when you are using the Add Data Source window,
click beside the search field. This updates the list of
all possible data sources. Individual data sources are not refreshed.
beside the search field. This updates the list of
all possible data sources. Individual data sources are not refreshed.
When you refresh a data
source for a report, columns that have been deleted from the table
metadata in the SAS LASR Analytic Server are automatically removed
if they do not impact any objects in the report. If deleted columns
do impact objects in the report, then the Repair Report window
is displayed so that you can repair the objects that are impacted
by the deleted columns. For more information,
see
Troubleshooting in SAS Visual Analytics Designer.
Remove a Data Source from a Report
You can remove all references
to a data source from a report in the designer. Be aware that removing
a data source means that all related data items are also removed from
the report objects within the report.
Note: Other reports that use the
same data source are not affected when you remove a data source from
a report.

Change a Data Source in a Report
To change a data source
in a report:
-
If a data item with the same name does not exist in the replacement data source, then it is automatically removed from the replacement data source if there are no report objects that use the data item. If there are report objects that use the data item, then those report objects will not work. The Repair Report window is displayed so that you can repair the objects that use the data item. For more information about repairing reports, see Troubleshooting in SAS Visual Analytics Designer.Data items in the replacement data source that have names that do not exist in the original data source are added to the Data tab automatically.Note: For data item names, the case is ignored when data sources are compared by the designer.
Show or Hide Data Items on the Data Tab
You can specify which
data items you want to see for the data source on the Data tab.
Your selections for which data items are shown or hidden are stored
with the report. For example, suppose that you hide data items in
one report, and then you open a second report that uses the same data
source. The data items in the second report are not hidden unless
you specifically hid them in that report, too.
To show or hide data
items:
Alternatively, you can
select a data item that you want to hide on the Data tab.
Right-click the data item, and select Hide Data Item.
You can also use a data
source filter to restrict the data that is displayed in a report. For more information,
see
Use a Data Source Filter in a Report.
Sort Data Items on the Data Tab
To sort data items on
the Data tab, click  , and then select one of the following:
The data items are sorted on the Data tab
within each grouping. The default sort is Ascending By
Name.
, and then select one of the following:
The data items are sorted on the Data tab
within each grouping. The default sort is Ascending By
Name.
, and then select one of the following:
-
Sort Items
 Ascending By Name
 -
Sort Items Descending By Name
For information
about sorting data values in report objects, see
Sorting Data in Reports.
Copyright © SAS Institute Inc. All rights reserved.