Exporting Data from Report Objects
Overview of Exporting from the Designer
All users who have the
Export Data capability can use the designer to export data from report
objects to Microsoft Excel format for future viewing or printing.
This exported output can be saved locally on disk, and then opened
in Microsoft Excel. Or you can choose to create a delimited text file
Tab-Separated Values (*.tsv) or Comma-Separated Values (*.csv) data
file.
When you export a graph
from the designer, you are exporting the data, not the visual graph
representation.
Not all report objects
in the designer support the exporting feature. For example, you cannot
export data from gauges. If the export feature is not available for
a particular report object, the Export <reportObjectName> menu
item does not appear when you right-click on the object.
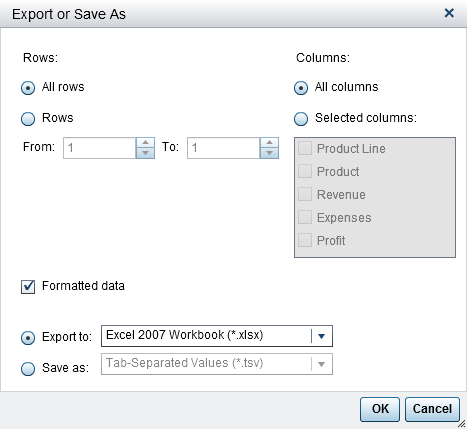
Export Data from a List Table
To export data from
a list table:
-
Choose to export All columns or Selected columns. If you choose Selected columns, select the check box (or check boxes) to the left of the column (or columns) that you want to export. At least one column is required. If you do not select a column, then a message is displayed, and the Export or Save As window cannot be closed.
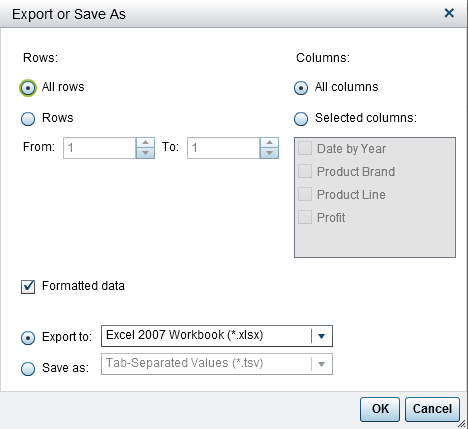
Export Data from a Crosstab
To export detail data
from a crosstab:
-
Choose to export All columns or Selected columns. If you choose Selected columns, select the check box (or check boxes) to the left of the column (or columns) that you want to export. At least one column is required. If you do not select a column, then a message is displayed, and the Export or Save As window cannot be closed.
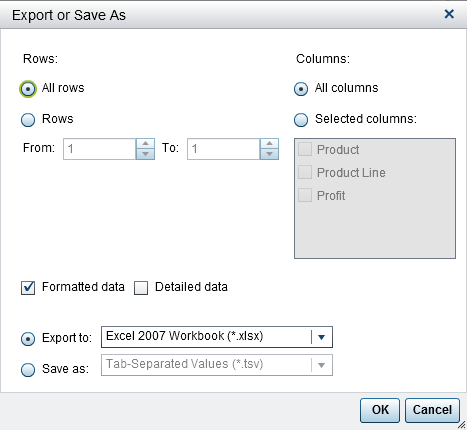
Export Data from a Graph
Note: You cannot export the actual
visual graph. Only the data can be exported.
To export data from
a graph:
-
Choose to export All columns or Selected columns. If you choose Selected columns, select the check box (or check boxes) to the left of the column (or columns) that you want to export. At least one column is required. If you do not select a column, then a message is displayed, and the Export or Save As window cannot be closed.
-
(Optional) Choose whether detail data is exported for the graph. If you select Detailed data, then you can select the columns that you want to export.Note: The Detailed data option is not available for imported report objects, custom graph objects that have multiple data definitions, or for any graphs in which detail data is not allowed.
Copyright © SAS Institute Inc. All rights reserved.