After the process flow
diagram has completed running, you can view the results that were
obtained by each node.
-
Select the
Text
Parsing node.
The Properties for the
Text
Parsing node appear in the Properties Panel.
Notice that the
Text
Parsing node’s
Parse Variable property
has been populated with the SYMPTOM_TEXT variable. This is because
the SYMPTOM_TEXT variable was the longest variable with a role of
Text in
the
VAEREXT_SERIOUS input data source.
-
Right-click the
Text
Parsing node and select
Results.
The
Results window
appears for the
Text Parsing node.
-
-
Click the
Freq column
heading to sort the terms by frequency.
Scroll through the list
of terms. Notice that for each term, the
Terms window
provides the number of documents the term appeared in, the frequency
of the term, and whether the term was kept.
-
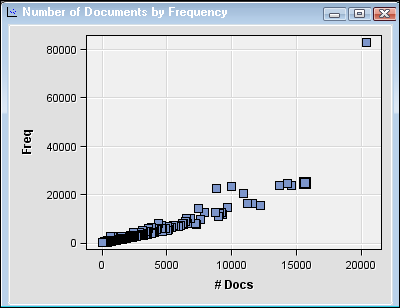
Select a term. Notice
that the point corresponding to this term is selected in the
ZIPF
Plot and the
Number of Documents by Frequency plot.
-
Close the
Results window.
-
Select the
Text
Filter node.
-
Right-click the
Text
Filter node and select
Results.
The
Results window
appears for the
Text Filter node.
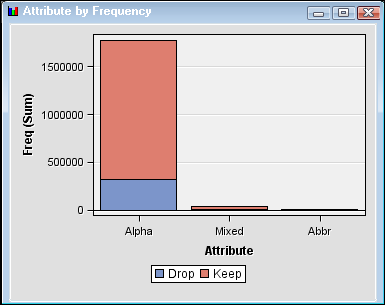
Notice that the
Attribute
by Frequency window and the
Role by Freq window
now show the number of terms in each category that were dropped or
kept.
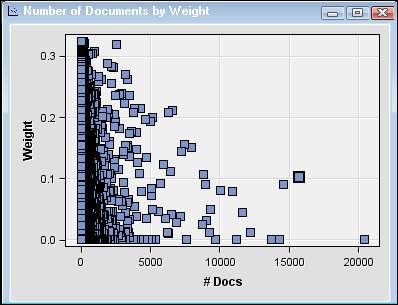
The
Number
of Documents by Weight plot shows the number of documents
in which each term appears relative to each term’s weight.
-
Close the
Results window.
-
Click the

for the
Filter Viewer property.
The
Interactive
Filter Viewer window appears.
-
View the terms in the
Terms window.
The terms are sorted first by their keep status and then by the number
of documents that they appear in.
Note: You can change the sorted
order by clicking a column heading.
-
View the documents in
the
Documents window.
-
Right-click a cell in
the
SYMPTOM_TEXT column, and then select
Toggle
Show Full Text to see the full text contained in SYMPTOM_TEXT.
-
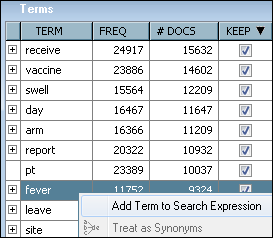
Select a term that is
related to an adverse reaction that you want to investigate further.
For example, select
fever under the TERM
column of the
Terms window. Right-click on
the term and select
Add Term to Search Expression.
-
Notice that the
Documents window
updates to only include entries that contain the term
fever.
-
Click
Clear,
and then click
Apply.
The terms in the
Terms window
resets.
-
Select the term
fever in
the
Terms window, and then right-click it
and select
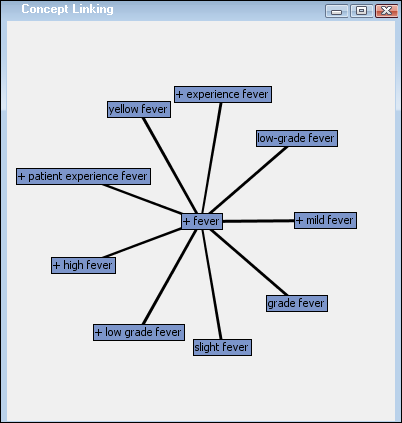
View Concept Links.
The
Concept
Linking window appears. Concept linking is a way to find
and display the terms that are highly associated with the selected
term in the
Terms table. The selected term
is surrounded by the terms that correlate the strongest with it. The
Concept
Linking window shows a hyperbolic tree graph with
fever in
the center of the tree structure. It shows you the other terms that
are strongly associated with the term
fever.
To expand the Concept
Linking view, select a term that is not in the center of the graph,
right-click it, and select
Expand Links.
-
Close the
Results window.
-
Select the
Text
Cluster node.
-
Right-click the
Text
Cluster node and select
Results.
The
Results window
appears.
-
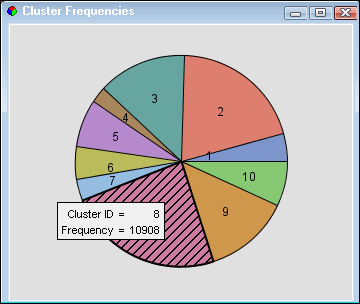
View the clusters in
the
Clusters window. Select a cluster.
Notice how the corresponding
cluster is selected in the
Cluster Frequencies chart,
the
Cluster Frequency by RMS plot, and the
Distance
Between Clusters plot.
-
Close the
Results window.