| Exploring Data in Two Dimensions |
Mosaic Plot Properties
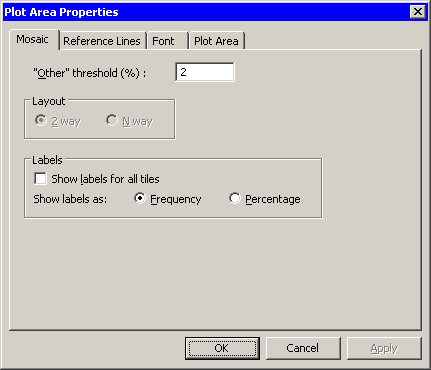
This section describes the Mosaic tab associated with a mosaic plot. To access the mosaic plot properties, right-click near the center of a plot, and select Plot Area Properties from the pop-up menu.
The Mosaic tab controls attributes of the mosaic plot. The Mosaic tab is shown in Figure 6.5.
- "Other" threshold (%)
- sets a cutoff value for determining which observations are placed into an "Others" category.
- Layout
-
sets the method by which cells are formed from the X and
Y variables.
- 2 way
- In this layout scheme, the X variables determine groups, and the mosaic plot displays a stacked bar chart of the Y variable for each group.
- N way
- This layout scheme is available only if there are exactly two X variables. In this layout scheme, the plot subdivides in the horizontal direction by the first X variable, then subdivides in the vertical direction by the Y variable, and finally subdivides in the horizontal direction by the second X variable.
- Show labels for all tiles
- specifies whether each cell is labeled with the proportion it represents.
- Show labels as
- specifies whether a cell represents frequency or percentage.
|
Figure 6.5: Plot Area Properties for a Mosaic Plot
For a discussion of the remaining tabs, see Chapter 9, "General Plot Properties."
Copyright © 2008 by SAS Institute Inc., Cary, NC, USA. All rights reserved.