| Exploring Data in Two Dimensions |
Example: A Group Variable
In this example you use the same data set and the co variable, but this time you plot the variable over a 24-hour period for each day of the week.
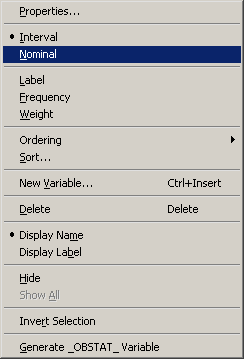
| In the data table, right-click on the day variable, and select nominal from the pop-up menu, as shown in Figure 6.16. |
|
Figure 6.16: Changing the Role of a Variable
Nominal variables can be used as group variables in the
construction of a line plot.
| Press the ESC key to deselect the day variable. |
| Select Graph |
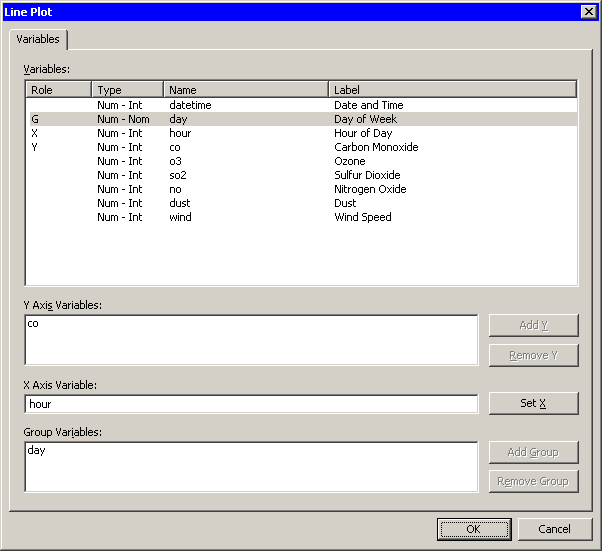
A dialog box appears (Figure 6.17).
| Select the variable co, and click Add Y. |
| Select the variable hour, and click Set X. |
| Select the variable day, and click Add Group. |
| Click OK. |
|
Figure 6.17: Specifying a Group Variable
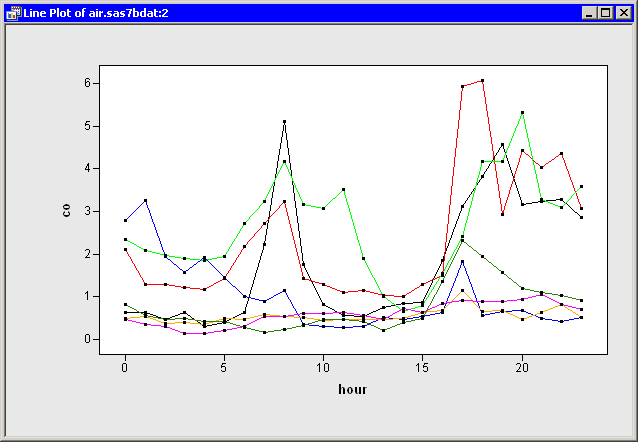
The line plot that appears (Figure 6.18) has seven lines,
one for each day of the week. For several days early in the week,
the daily carbon monoxide peaked during the morning and
evening commuting times: roughly 8 a.m. and 6 - 7 p.m.
|
Figure 6.18: A Line Plot with a Group Variable
To better visualize each day's carbon dioxide, you can use a bar chart
to select each day individually.
| Select Graph |
The Bar Chart dialog box appears.
| Select the day variable, and click Set X. |
| Click OK. |
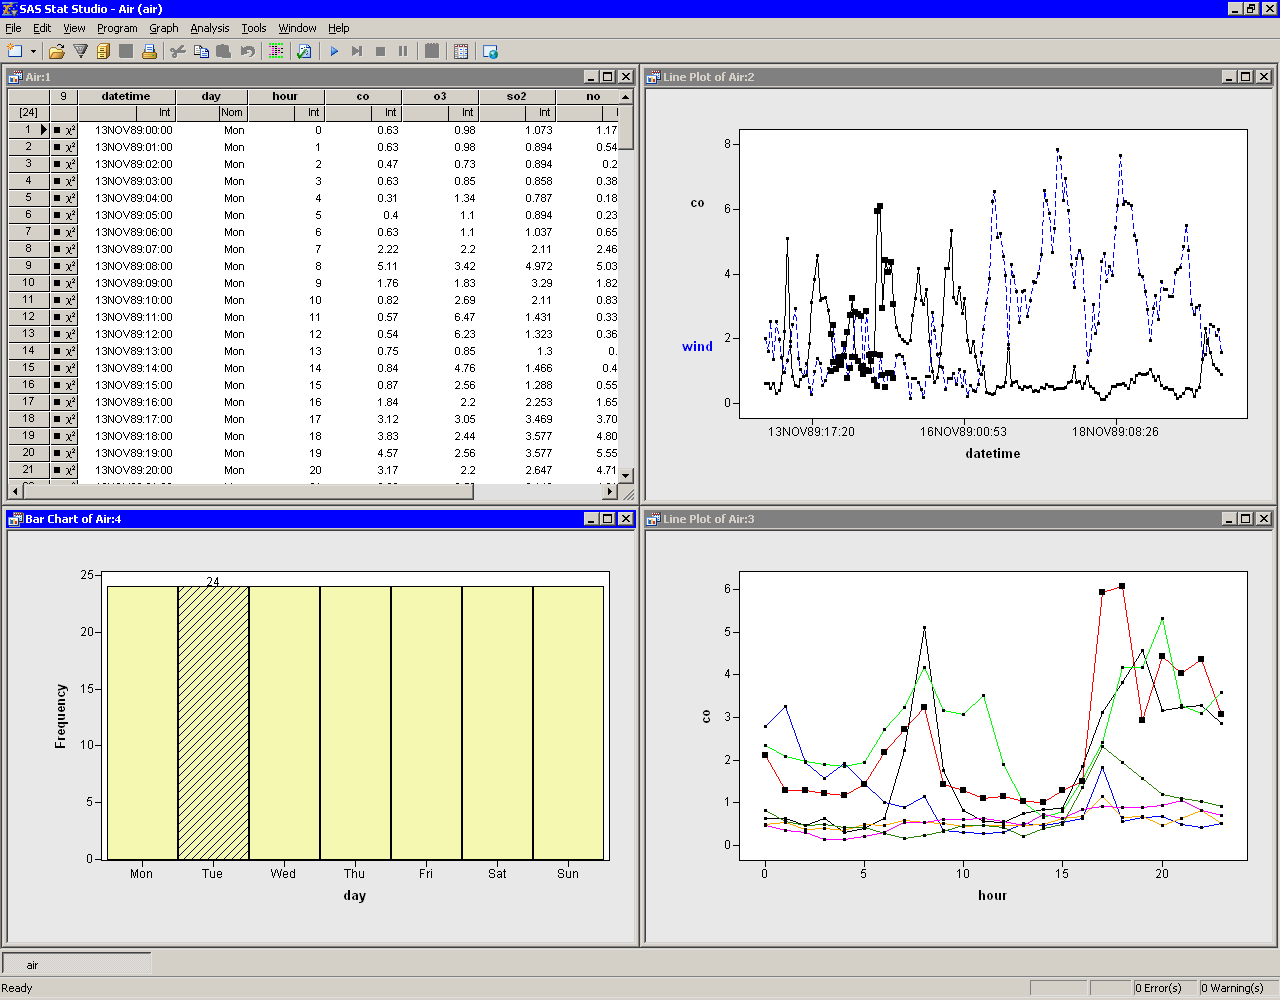
The resulting plots are shown in Figure 6.19.
You can now select each day of the week and examine the observations
for that day.
|
Figure 6.19: Exploring Data for Each Day
Copyright © 2008 by SAS Institute Inc., Cary, NC, USA. All rights reserved.