| Techniques for Exploring Data |
Excluding Observations
This section describes how to exclude selected observations from
plots and from statistical analyses. The data table must be the active
window in order for you to exclude observations.
Select Edit ![]() Observations
Observations ![]() Exclude from Plots
from the main menu to exclude selected observations
from plots. Select
Edit
Exclude from Plots
from the main menu to exclude selected observations
from plots. Select
Edit ![]() Observations
Observations ![]() Exclude from Analyses
to exclude selected observations from analyses.
Exclude from Analyses
to exclude selected observations from analyses.
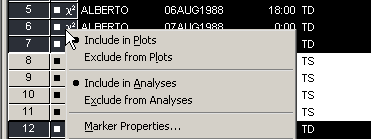
Alternatively, you can right-click on the row heading
of any selected observation in the data table and select Exclude from Plots or
Exclude from Analyses from the pop-up menu, as shown in
Figure 11.4.
|
Figure 11.4: Data Table Pop-up Menu
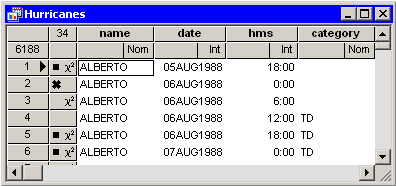
The row heading of the data
table shows the status of an observation in analyses and plots. A
marker symbol indicates that the observation is included in plots;
observations excluded from plots do not have a marker symbol shown in
the data table. Similarly, the ![]() symbol is present if and only
if the observation is included in analyses.
For example, the first, fifth, and sixth
observations in Figure 11.5 are included in plots and
analyses.
symbol is present if and only
if the observation is included in analyses.
For example, the first, fifth, and sixth
observations in Figure 11.5 are included in plots and
analyses.
|
Figure 11.5: Excluded Observations
If you exclude observations from plots, all plots linked to the current data table automatically redraw themselves. (For example, excluding an extreme value might result in a new range for an axis.) The row headings for the excluded observations no longer show the observation marker. For example, the third and fourth observations in Figure 11.5 are excluded from plots.
If you exclude observations from analyses, the
row headings for the excluded observations no longer show the
![]() symbol. For example, the second and fourth observations in
Figure 11.5 are excluded from analyses.
symbol. For example, the second and fourth observations in
Figure 11.5 are excluded from analyses.
Caution: If you change the observations included in analyses, previously run analyses and statistics are not automatically rerun.
If an observation is
excluded from analyses but included in plots, then the marker symbol
changes to the ![]() symbol. This combination is useful if you want
to fit a regression model to data but also want to
exclude outliers or high-leverage observations prior to modeling.
The regression model does not use the excluded observations, but the
observations show up (as
symbol. This combination is useful if you want
to fit a regression model to data but also want to
exclude outliers or high-leverage observations prior to modeling.
The regression model does not use the excluded observations, but the
observations show up (as ![]() ) on diagnostic plots for the
regression.
) on diagnostic plots for the
regression.
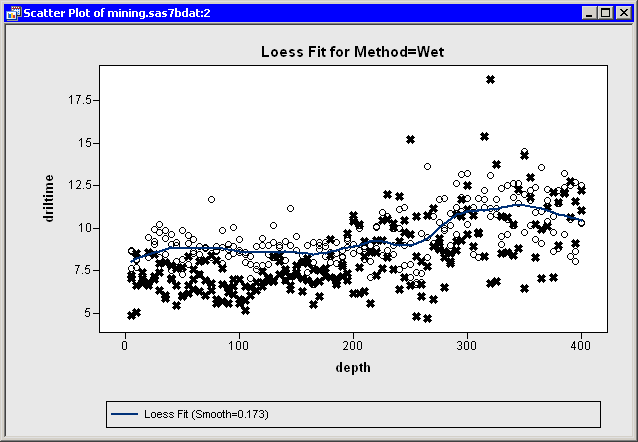
An example of including some observations in plots but not in analyses
is shown in Figure 11.6. The figure shows data from
the Mining data set - the results of an experiment to determine
whether drilling time was faster for wet drilling or dry drilling.
The plot shows the time required to drill the last five feet of a hole
plotted against the depth of the hole. A loess fit is plotted only for
the wet drilling trials (open circles). This is accomplished by
excluding the observations for dry drilling (markers with the
![]() shape) before running the loess analysis.
shape) before running the loess analysis.
|
Figure 11.6: Loess Fit of a Subset of Data
Although Stat Studio analyses do not support BY-group processing, you can restrict an
analysis to a single BY group by excluding all other BY groups.
For data with many BY groups, this is tedious
to do using the Stat Studio GUI, but you can write an IMLPlus program to
automate the processing of BY groups.
You easily restore all observations into plots and analyses:
- Activate the data table. Press CTRL+A. This selects all observations in the table.
- Select
Edit
 Observations Include in Plots
from the main menu.
Observations Include in Plots
from the main menu.
- Select
Edit Observations Include in Analyses
from the main menu.
Copyright © 2008 by SAS Institute Inc., Cary, NC, USA. All rights reserved.