| Data Smoothing: Thin-Plate Spline |
The Output Variables Tab
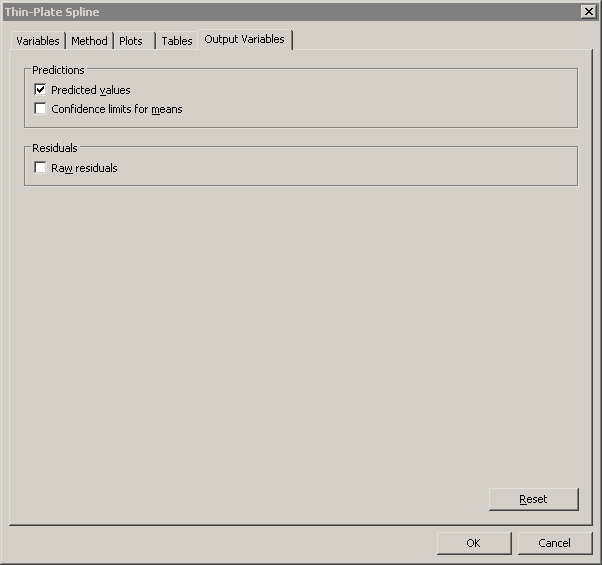
You can use the Output Variables tab (Figure 19.7) to add analysis variables to the data table. If you request a plot that uses one of the output variables, then that variable is automatically created even if you did not explicitly select the variable on the Output Variables tab.
The following list describes each output variable and indicates how it
is named. ![]() represents the name of
the response variable.
represents the name of
the response variable.
- Predicted values
-
adds predicted values.
The variable is named TPSplP_
 .
.
- Confidence limits for means
-
adds 95% confidence limits for the expected value (mean).
The variables are named TPSplLclm_ and TPSplUclm_.
- Raw residuals
-
adds residuals, calculated as observed minus predicted values.
The variable is named TPSplR_.
|
Figure 19.7: The Output Variables Tab
Copyright © 2008 by SAS Institute Inc., Cary, NC, USA. All rights reserved.