| Data Smoothing: Thin-Plate Spline |
The Tables Tab
You can use the Tables tab to display tables that summarize the results of the analysis.
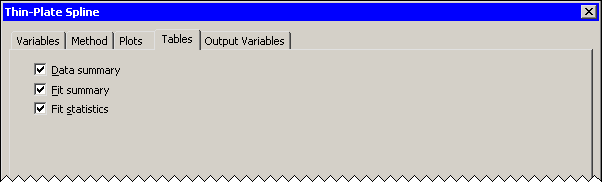
The Tables tab is shown in Figure 19.6. The following tables are available:
- Data summary
- summarizes information about the number of observations.
- Fit summary
- summarizes the model parameters.
- Fit statistics
- summarizes the fit, including the smoothing value that optimizes the selection criterion.
|
Figure 19.6: The Tables Tab
Copyright © 2008 by SAS Institute Inc., Cary, NC, USA. All rights reserved.