| General Plot Properties |
The Plot Area Tab
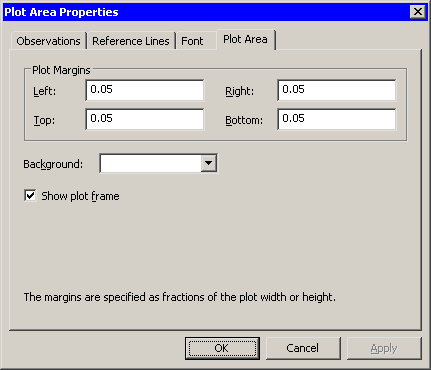
You can use the Plot Area tab (Figure 9.18) to set
attributes of the plot area.
|
Figure 9.18: The Plot Area Tab
- Left
- specifies the distance between the left edge of the plot area and the minimum value of the visible axis range for the X axis. The distance is specified as a fraction of the plot area's width. The value must be in the range 0 to 0.8.
- Right
- specifies the distance between the right edge of the plot area and the maximum value of the visible axis range for the X axis. The distance is specified as a fraction of the plot area's width. The value must be in the range 0 to 0.8.
- Top
- specifies the distance between the top edge of the plot area and the maximum value of the visible axis range for the Y axis. The distance is specified as a fraction of the plot area's height. The value must be in the range 0 to 0.8.
- Bottom
- specifies the distance between the bottom edge of the plot area and the minimum value of the visible axis range for the Y axis. The distance is specified as a fraction of the plot area's height. The value must be in the range 0 to 0.8.
- Background
- specifies the background color of the plot area.
- Show plot frame
- specifies whether the plot area's frame is displayed.
Note:
Because the plot area has margins, the edges of the plot area do not
correspond to the minimum and maximum values of the axis.
Let ![]() and
and ![]() be the minimum and maximum values of the horizontal axis.
Let
be the minimum and maximum values of the horizontal axis.
Let ![]() and
and ![]() be the left and right margin fractions.
be the left and right margin fractions.
Define ![]() .
Then the left edge of the plot area is located at
.
Then the left edge of the plot area is located at ![]() ,
and the right edge of the plot area is located at
,
and the right edge of the plot area is located at ![]() .
.
For example, if ![]() ,
, ![]() ,
,
![]() , and
, and ![]() , then
, then ![]() .
The left edge of the plot area is located at
.
The left edge of the plot area is located at ![]() ,
while the right edge is located at
,
while the right edge is located at ![]() .
.
Copyright © 2008 by SAS Institute Inc., Cary, NC, USA. All rights reserved.