| General Plot Properties |
The Font Tab
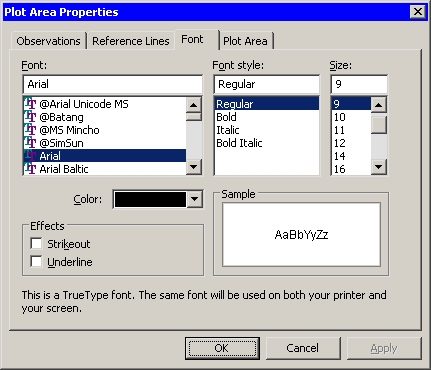
You can use the Font tab (Figure 9.17) to set
attributes of the font used to display observation labels in plots.
The section "Labeling Observations" discusses observation labels.

|
Figure 9.17: The Font Tab
- Font
- specifies the font used for text in the plot area.
- Font style
- specifies the style of the font used for text in the plot area.
- Size
- specifies the point size of the text in the plot area.
- Color
- specifies the color of the text in the plot area.
- Sample
- shows what text with the specified properties looks like.
- Strikeout
- specifies whether a line is drawn through text in the plot area.
- Underline
- specifies whether a line is drawn below text in the plot area.
Copyright © 2008 by SAS Institute Inc., Cary, NC, USA. All rights reserved.