| Interacting with Plots |
Example
In this example, you insert text that displays certain statistics related to a scatter plot of two variables.
| Open the Hurricanes data set, and create a scatter plot of wind_kts versus min_pressure. |
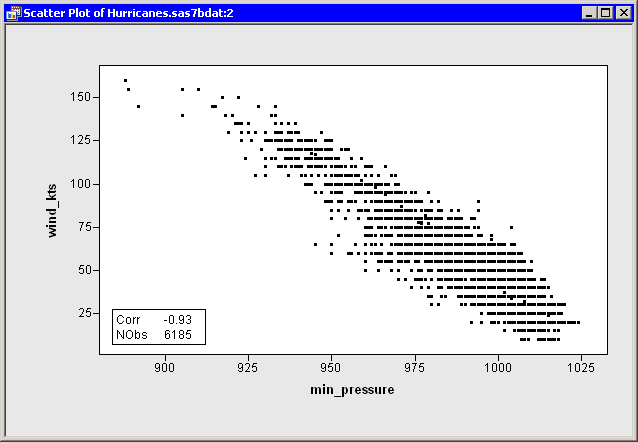
The scatter plot (Figure 8.4) shows a strong negative correlation between wind speed and pressure. A correlation analysis reveals the following:
- There are 6185 observations for which both variables are nonmissing.
- The correlation between these two variables is approximately - 0.93.
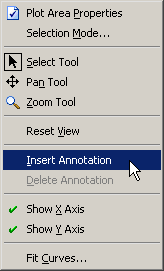
| Right-click in the plot, and select Insert Annotation from the pop-up menu. |
|
Figure 8.3: Creating an Annotation
The mouse pointer changes its shape. It looks like a pencil with the
letter "A" next to it.
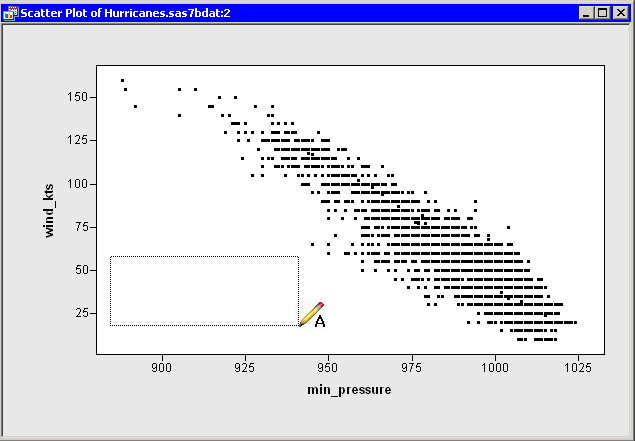
| Drag out a rectangle with the mouse pointer, as shown in Figure 8.4. |
|
Figure 8.4: Inserting an Annotation
| Type text into the text box, as shown in Figure 8.5. Click outside the text box to finish editing the text. |
You can resize or move the text rectangle after it is created, if necessary.
You can also right-click on the text box to change properties of the
text or the text box. For example, in Figure 8.5
the text box is displayed with a border around it. The
annotation properties are discussed in the section "Annotation Properties".
|
Figure 8.5: An Inset Containing Statistics
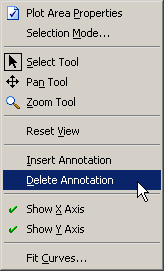
If you decide to delete the annotation, click on the text box to select it. Then right-click outside the text box, and select Delete Annotation from the pop-up menu, as shown in Figure 8.6.
Caution: If you right-click inside the text box, you get a
different menu, as discussed in the following section.
|
Figure 8.6: Deleting an Annotation
Copyright © 2008 by SAS Institute Inc., Cary, NC, USA. All rights reserved.