| Adding Titles, Legends, and Insets |
Adding Titles, Legends, and Insets
In Chapter 7, "Reading ODS Tables," you learned how to write ODS tables to SAS data sets and then how to read variables from the data sets into IML matrices. This chapter shows you how to create titles, legends, and insets on plots. (An inset is a box drawn on the plot containing statistics.) In particular, you learn how to incorporate the information from ODS tables into titles, legends, and insets.
The program statements in this chapter are distributed with Stat Studio. To open the program containing the statements:
- Select File
 Open File from the main menu.
- Click Go to Installation directory near the bottom of the dialog box.
- Navigate to the Programs\Doc\STATGuide folder.
- Select the Titles.sx file.
- Click Open.
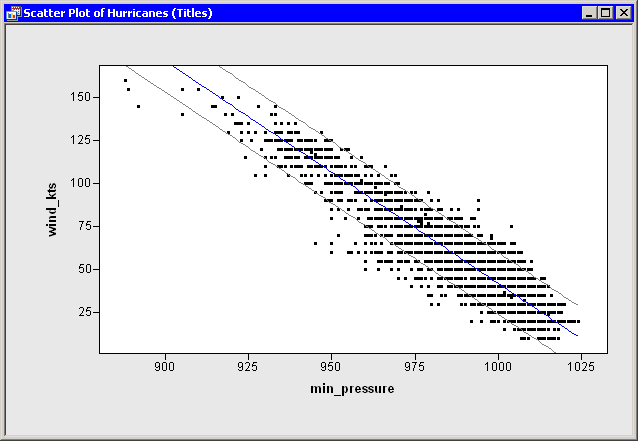
Suppose you perform a linear regression with PROC REG, and you create
a scatter plot showing the fitted model and 95% confidence intervals
for individual predictions as shown in Figure 8.1. You
learned how to do this in Chapter 6, "Adding Curves to Plots."
|
Figure 8.1: A Fitted Model and Confidence Intervals
Suppose further that you want the plot to include the following information about
the linear regression:
- a title that shows the fitted model
- a legend that explains the different colors of lines in the plot
- an inset that shows the number of observations used in the regression and the R-square value of the fitted model
In Chapter 7, "Reading ODS Tables," you learned how to get all of the needed
information out of the ODS tables output by using PROC REG. The program
that follows combines ideas from previous chapters. Copy the following
statements into a program window, and select Program ![]() Run
from the main menu.
Run
from the main menu.
 declare DataObject dobj;
 dobj = DataObject.CreateFromFile("Hurricanes");

 dobj.WriteVarsToServerDataSet( {"wind_kts" "min_pressure"},
    "work", "Hurr", true );

 submit;
 proc reg data=hurr;
    model wind_kts = min_pressure;
    output out=RegOut P=Pred LCL=LCL UCL=UCL;
    ods output NObs = RegNObs
               FitStatistics = RegFitStat
               ParameterEstimates = RegParamEst;
 run;
 endsubmit;

 ok = CopyServerDataToDataObject( "work", "RegOut", dobj,
    {"Pred" "LCL" "UCL"}, /* names on server */
    {"Pred" "LCL" "UCL"}, /* names in DataObject */
    {"Predicted" "Lower Conf. Limit" "Upper Conf. Limit"},
    true );

 declare ScatterPlot FitPlot;
 FitPlot = ScatterPlot.Create( dobj, "min_pressure", "wind_kts" );

 dobj.Sort( "min_pressure" );
 dobj.GetVarData( "min_pressure", minPress );
 dobj.GetVarData( "Pred", pred );
 FitPlot.DrawUseDataCoordinates();
 FitPlot.DrawSetPenColor( BLUE );
 FitPlot.DrawLine( minPress, pred );

 dobj.GetVarData( "LCL", lower );
 dobj.GetVarData( "UCL", upper );
 FitPlot.DrawSetPenColor( GRAY );
 FitPlot.DrawLine( minPress, lower );
 FitPlot.DrawLine( minPress, upper );

 use RegNObs;     read all var {N};        close RegNObs;
 use RegFitStat;  read all var {NValue2};  close RegFitStat;
 use RegParamEst; read all var {Estimate}; close RegParamEst;

 print "--------------------------------------";
 print N[ rowname={"Num Read","Num Used","Num Missing"} ],
       NValue2[ rowname={"R-Square","Adj R-sq"," "} ],
       Estimate[ rowname={"Intercept","min_pressure"} ];
You can add a title to a plot by calling the SetTitleText and ShowTitle methods of the Plot class. However, in this case you first need to convert the values stored in the Estimate matrix from numerical to character values. One way to do this is to apply a w.d format by using the Base function PUTN. You can then concatenate pieces of the title together using the IML CONCAT function, and display the result.
The statements that follow build the title intelligently. Let ![]() be
the intercept and
be
the intercept and ![]() be the slope of the regression line. The
regression line for this example has negative slope (
be the slope of the regression line. The
regression line for this example has negative slope (![]() ). If
you built the title as
). If
you built the title as
title = concat("wind_kts = ", b0, " + ", b1, " * min_pressure");
then the title string might appear as
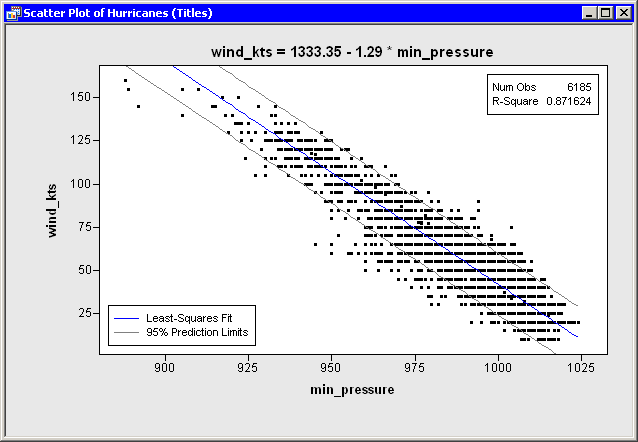
wind_kts = 1333.35 + -1.29 * min_pressureWhile this is correct, it is awkward to read. A more aesthetic title would be
wind_kts = 1333.35 - 1.29 * min_pressure
This can be accomplished by treating the case of negative slope separately from the case of positive slope.
Add the following statements at the bottom of the program window, and select
Program ![]() Run from the main menu. Figure 8.2
shows how the title appears.
Run from the main menu. Figure 8.2
shows how the title appears.
 b0 = putn(Estimate[1], "7.2");
 if Estimate[2]<0 then do;          /* if slope is negative */
    sign = " - ";                   /* display b0 - (-b1)   */
    b1 = putn(-Estimate[2], "4.2");
    end;
 else do;                           /* else display b0 + b1 */
    sign = " + ";
    b1 = putn(Estimate[2], "4.2");
    end;
 title = concat("wind_kts = ", b0, sign, b1, " * min_pressure" );
 FitPlot.SetTitleText( title );
 FitPlot.ShowTitle();
Adding a legend
is usually accomplished by using
the DrawLegend module
that
is distributed with Stat Studio. The module is documented in
the Stat Studio online Help
.
The statements that follow show one choice for displaying a legend.
Add these at the bottom of the program window, and select Program
![]() Run from the main menu.
Figure 8.2 shows how the legend appears.
Run from the main menu.
Figure 8.2 shows how the legend appears.
 Labels = {"Least-Squares Fit" "95% Prediction Limits"};
 LabelSize = 8;            /* 8 point font */
 LineColor = BLUE || GRAY; /* form 1x2 matrix */
 LineStyle = SOLID;        /* all lines are solid */
 Symbol = -1;              /* no symbols */
 BackgroundColor = WHITE;
 Location = 'ILB';         /* Inside, Left, Bottom */
 run DrawLegend( FitPlot, Labels, LabelSize,
                   LineColor, LineStyle, Symbol,
                   BackgroundColor, Location );
Note the use of the IML concatenation operator ||.
This operator takes the two predefined integers BLUE and GRAY
and concatenates them into a ![]() matrix.
matrix.
Caution: Trying to form the matrix by using the statement
LineColor = {BLUE GRAY}; /* wrong! */
does not work because IML interprets that statement as forming a
character matrix with values "BLUE" and "GRAY."
Similarly, as the next statement illustrates, you must use the
concatenation operator when creating a matrix from submatrices. You
cannot write
Values = {N[2] NValue2[1]}; /* wrong! */
You can add an inset
by using the DrawInset module
that is distributed with Stat Studio. The module is documented in
the Stat Studio online Help
.
The code that follows shows one choice for creating an inset. Add the
following statements at the bottom of the program window, and select
Program ![]() Run from the main menu.
Figure 8.2 shows how the inset appears.
Run from the main menu.
Figure 8.2 shows how the inset appears.
 Labels = {"Num Obs" "R-Square"};
 Values = N[2] || NValue2[1];
 LabelProps = .;          /* accept default settings for labels */
 LabelTypeface = "Arial"; /* font */
 BackgroundColor = -1;    /* no color (transparent) */
 Location = 'IRT';        /* Inside, Right, Top */
 run DrawInset( FitPlot, Labels, Values,
                  LabelProps, LabelTypeface,
                  BackgroundColor, Location );
|
Figure 8.2: Plot with Title,Legend,and Inset