The SPP Procedure
-
Overview

- Getting Started
-
Syntax
-
DetailsTesting for Complete Spatial RandomnessExploring Interpoint InteractionDistance Functions for Multitype Point PatternsBorder Edge Correction for Distance FunctionsConfidence Intervals for Summary StatisticsRipley-Rasson Window EstimatorCovariate Dependence TestsNonparametric Intensity EstimationInhomogeneous Poisson Process Model FittingOutput Data SetsDisplayed OutputODS Table NamesODS Graphics
-
Examples
- References
In most spatial analysis applications, you are likely to have one or more covariates in addition to the point pattern data set. Hence, you can test for a possible dependency between the observed point pattern and the covariates by using covariate dependency tests that compute empirical distribution function (EDF) statistics. These tests are nonparametric, and the selected EDF statistic indicates whether events are independent from a covariate. Covariate dependency testing serves a broader purpose and can help you design point process intensity models.
To request a covariate dependency test that is based on an EDF statistic, you use the COVTEST statement, in which you specify the point process and the covariates that need to be tested. The following statements perform a covariate dependency test that is based on an EDF statistic:
proc spp data=sashelp.bei;
   process trees = (x,y /area=(0,0,1000,500) event=Trees);
   trend grad = field(x,y,Gradient);
   trend elev = field(x,y,Elevation);
   covtest trees = grad elev;
run;
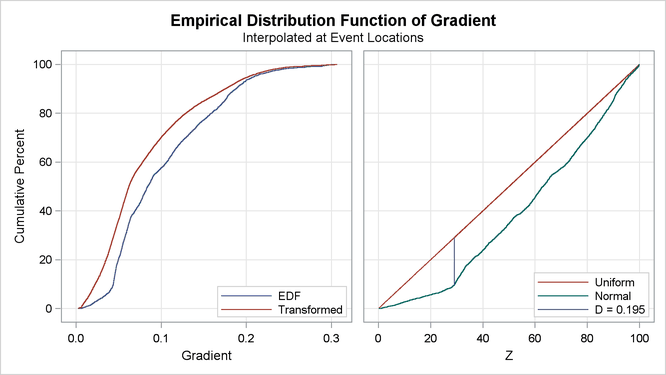
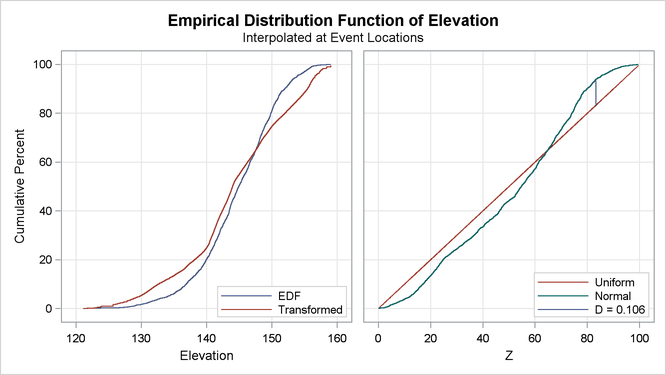
When you do not request any specific EDF test statistic, by default the SPP procedure produces an EDF test that uses the Kolmogorov-Smirnov statistic for each covariate that is specified in the COVTEST statement, as shown in Output 93.2.1.
Output 93.2.1 reports the value of the Kolmogorov-Smirnov D test statistic and a p-value. The p-value indicates that the null hypothesis of independence on the covariate is rejected. In addition to the test statistic
and the p-value, PROC SPP produces a plot of the empirical and transformed distribution function for each covariate. Output 93.2.2 and Output 93.2.3 show the plots of the Kolmogorov-Smirnov statistic for the covariates Gradient and Elevation, respectively. In each figure, the plot on the left includes the empirical density function (EDF) of the variable (solid
blue line) and the weighted EDF (transformed EDF or transformed line). The plot on the right compares the EDF of the transformed
EDF (green line) against the cumulative density function of the standard uniform distribution ![]() (red line). The same plot also shows the largest vertical difference between the normal and uniform lines, which is the Kolmogorov-Smirnov
statistic D. From the right plots in Output 93.2.2 and Output 93.2.3, it is quite apparent that the normal line overlaps only at the ends for the
(red line). The same plot also shows the largest vertical difference between the normal and uniform lines, which is the Kolmogorov-Smirnov
statistic D. From the right plots in Output 93.2.2 and Output 93.2.3, it is quite apparent that the normal line overlaps only at the ends for the Gradient covariate and crosses the uniform line once for the Elevation covariate. Thus, you can infer that the Gradient covariate (in addition to having a higher D statistic value) deviates considerably from the uniform line.