The QUANTSELECT Procedure

This example shows how you can use the PARTITION statement and other options to control the effect selection process. The data for this example come from a study by McDonald and Schwing (1973). The data set contains 60 observations, 15 covariates, and one response variable. The response variable is the total age-adjusted mortality rate for Standard Metropolitan Statistical Areas in 1959–1961.
The following statements fit a median model for mortality rate conditional on a set of climate, demographic, and pollution
covariates by using the forward selection method. Because linear terms alone might not be sufficient to fit this model, quadratic
terms are also added in the MODEL statement. The FRACTION option of the PARTITION statement requests that 30% of the observations
be used for validation and the remaining 70% of the observations for training. The HIER=SINGLE option in the MODEL statement
forces the effect selection process to ignore quadratic effect candidates if their corresponding main effects are not in the
model. The OUTPUT statement creates a SAS data set named OutData, which contains the variable _ROLE_. This variable shows the role of each observation that the PARTITION statement assigns.
data mortality;
   input index aap ajant ajult size65 nph nsch25 nfek ppsm snwp nowk nin3k
   hpi nopi sdpi datm DeathRate;
   label index="the index"
      aap="Average Annual Precipitation"
      ajant="Average January Temperature"
      ajult="Average July Temperature"
      size65="Size of Population older than 65"
      nph="Number of Members per Household"
      nsch25="Number of Years of Schooling for Persons over 25"
      nfek="Number of Households with fully Equipped Kitchens"
      ppsm="Population per Square Mile"
      snwp="Size of the Nonwhite Population"
      nowk="Number of Office Workers"
      nin3k="Number of Families with an Income less than $3000"
      hpi="Hydrocarbon Pollution Index"
      nopi="Nitric Oxide Pollution Index"
      sdpi="Sulfur Dioxide Pollution Index"
      datm="Degree of Atmospheric Moisture"
      DeathRate="Age-Adjusted Death Rate: Deaths per 100,000 Population";
   datalines;
 1  36  27  71   8.1  3.34  11.4  81.5  3243   8.8  42.6  11.7   21
    15   59  59   921.870
 2  35  23  72  11.1  3.14  11.0  78.8  4281   3.6  50.7  14.4    8
    10   39  57   997.875
 3  44  29  74  10.4  3.21   9.8  81.6  4260   0.8  39.4  12.4    6
     6   33  54   962.354
 4  47  45  79   6.5  3.41  11.1  77.5  3125  27.1  50.2  20.6   18
     8   24  56   982.291
 5  43  35  77   7.6  3.44   9.6  84.6  6441  24.4  43.7  14.3   43

   ... more lines ...

    11   42  56  1003.502
58  45  24  70  11.8  3.25  11.1  79.8  3678   1.0  44.8  14.0    7
     3    8  56   895.696
59  42  83  76   9.7  3.22   9.0  76.2  9699   4.8  42.2  14.5    8
     8   49  54   911.817
60  38  28  72   8.9  3.48  10.7  79.8  3451  11.7  37.5  13.0   14
    13   39  58   954.442
;
ods graphics on;
proc quantselect data=Mortality seed=800 plots=all;
   partition fraction(validate=0.3);
   model DeathRate = aap aap*aap ajant ajant*ajant ajult
      ajult*ajult size65 size65*size65 nph nph*nph nsch25
      nsch25*nsch25 nfek nfek*nfek  ppsm ppsm*ppsm snwp snwp*snwp
      nowk nowk*nowk nin3k nin3k*nin3k hpi hpi*hpi nopi
      nopi*nopi sdpi sdpi*sdpi datm datm*datm
      / quantile=0.5 selection=forward(choose=val sh=8) hier=single;
   output out=OutData p=Pred;
run;

proc print data=OutData(obs=10); run;
Output 84.3.1 shows the selection summary. You can see that the best model is at step 13 for validation ACL, step 5 for the SBC, and step 14 for the AIC.
Output 84.3.1: Selection Summary
| Selection Summary | |||||||
|---|---|---|---|---|---|---|---|
| Step | Effect Entered |
Number Effects In |
AIC | AICC | SBC | Validation ACL |
Adjusted R1 |
| 0 | Intercept | 1 | 276.5053 | 276.6005 | 278.2895 | 31.7900 | 0.0000 |
| 1 | snwp | 2 | 251.6460 | 251.9387 | 255.2144 | 23.9139 | 0.2455 |
| 2 | sdpi | 3 | 240.3445 | 240.9445 | 245.6971 | 20.3977 | 0.3355 |
| 3 | nopi | 4 | 238.3223 | 239.3480 | 245.4591 | 16.9704 | 0.3493 |
| 4 | ppsm | 5 | 239.3875 | 240.9664 | 248.3084 | 16.3677 | 0.3397 |
| 5 | aap | 6 | 226.5892 | 228.8595* | 237.2943* | 15.7333 | 0.4272 |
| 6 | aap*aap | 7 | 227.6860 | 230.7971 | 240.1754 | 14.8892 | 0.4177 |
| 7 | ajult | 8 | 228.5136 | 232.6279 | 242.7871 | 14.5477 | 0.4095 |
| 8 | nin3k | 9 | 229.4258 | 234.7199 | 245.4835 | 14.3532 | 0.4001 |
| 9 | ajant | 10 | 224.7397 | 231.4063 | 242.5816 | 13.5693 | 0.4276* |
| 10 | ppsm*ppsm | 11 | 226.5785 | 234.8285 | 246.2046 | 12.4032 | 0.4114 |
| 11 | hpi | 12 | 228.5050 | 238.5696 | 249.9153 | 11.6356 | 0.3935 |
| 12 | ajant*ajant | 13 | 229.9796 | 242.1129 | 253.1740 | 11.1214 | 0.3776 |
| 13 | nfek | 14 | 231.9208 | 246.4035 | 256.8994 | 10.9947* | 0.3573 |
| 14 | snwp*snwp | 15 | 221.3905* | 238.5334 | 248.1533 | 13.3735 | 0.4234 |
| 15 | ajult*ajult | 16 | 223.3153 | 243.4635 | 251.8624 | 13.0557 | 0.4033 |
| 16 | sdpi*sdpi | 17 | 224.8099 | 248.3483 | 255.1411 | 14.2347 | 0.3847 |
| 17 | size65 | 18 | 226.7756 | 254.1356 | 258.8910 | 14.3067 | 0.3613 |
| 18 | nin3k*nin3k | 19 | 223.8621 | 255.5288 | 257.7618 | 14.5143 | 0.3719 |
| 19 | nfek*nfek | 20 | 224.0342 | 260.5559 | 259.7180 | 14.6314 | 0.3591 |
| 20 | datm | 21 | 222.7062 | 264.7062 | 260.1742 | 15.4604 | 0.3561 |
| * Optimal Value Of Criterion | |||||||
Output 84.3.2 shows the selected effects and the relevant estimates.
Output 84.3.2: Parameter Estimates
| Parameter Estimates | |||
|---|---|---|---|
| Parameter | DF | Estimate | Standardized Estimate |
| Intercept | 1 | 909.689797 | 0 |
| aap | 1 | 4.634741 | 0.750747 |
| aap*aap | 1 | -0.047789 | -0.533679 |
| ajant | 1 | 0.009723 | 0.001962 |
| ajant*ajant | 1 | -0.020447 | -0.389447 |
| ajult | 1 | -1.672607 | -0.146182 |
| nfek | 1 | -0.323920 | -0.030436 |
| ppsm | 1 | -0.007194 | -0.194141 |
| ppsm*ppsm | 1 | 0.000001906 | 0.534144 |
| snwp | 1 | 3.483423 | 0.574703 |
| nin3k | 1 | 3.228388 | 0.252681 |
| hpi | 1 | -0.401693 | -0.351016 |
| nopi | 1 | 0.795823 | 0.389110 |
| sdpi | 1 | 0.151049 | 0.152444 |
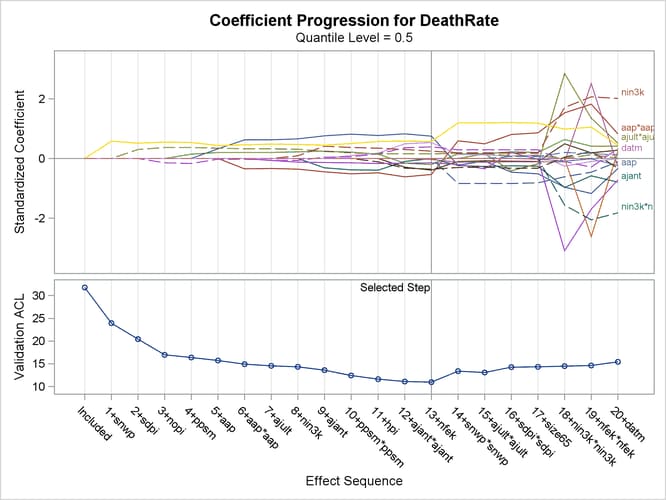
Output 84.3.3 shows the progression of the standardized parameter estimates as the selection process proceeds.
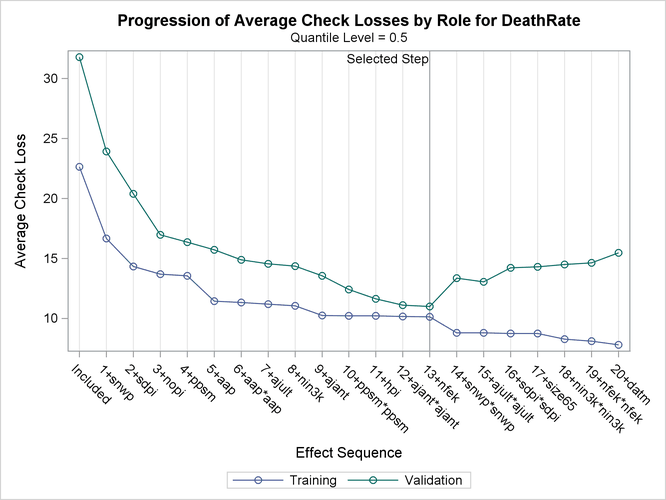
Output 84.3.4 shows the progression of the average check losses for training data and validation data as the selection process proceeds.
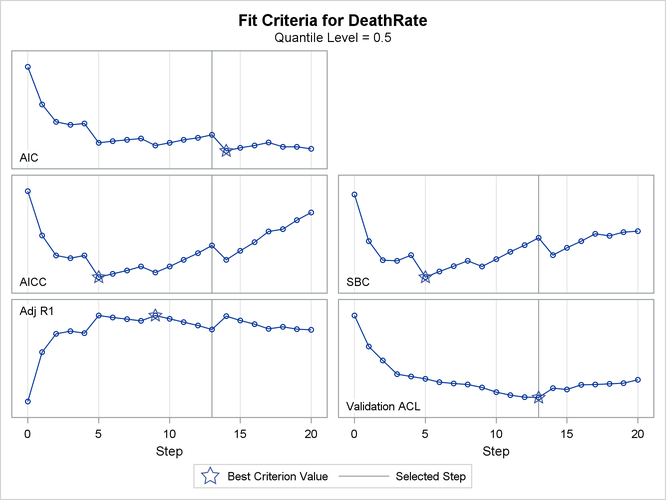
Output 84.3.5 shows the progression of five effect selection criteria as the selection process proceeds.
Output 84.3.6 shows the first 10 observations of the OUTPUT data set.
Output 84.3.6: OUTPUT Data Set
| Obs | index | aap | ajant | ajult | size65 | nph | nsch25 | nfek | ppsm | snwp | nowk | nin3k | hpi | nopi | sdpi | datm | DeathRate | Pred | _ROLE_ |
|---|---|---|---|---|---|---|---|---|---|---|---|---|---|---|---|---|---|---|---|
| 1 | 1 | 36 | 27 | 71 | 8.1 | 3.34 | 11.4 | 81.5 | 3243 | 8.8 | 42.6 | 11.7 | 21 | 15 | 59 | 59 | 921.87 | 932.36 | TRAIN |
| 2 | 2 | 35 | 23 | 72 | 11.1 | 3.14 | 11.0 | 78.8 | 4281 | 3.6 | 50.7 | 14.4 | 8 | 10 | 39 | 57 | 997.88 | 930.62 | VALIDATE |
| 3 | 3 | 44 | 29 | 74 | 10.4 | 3.21 | 9.8 | 81.6 | 4260 | 0.8 | 39.4 | 12.4 | 6 | 6 | 33 | 54 | 962.35 | 908.09 | TRAIN |
| 4 | 4 | 47 | 45 | 79 | 6.5 | 3.41 | 11.1 | 77.5 | 3125 | 27.1 | 50.2 | 20.6 | 18 | 8 | 24 | 56 | 982.29 | 983.55 | TRAIN |
| 5 | 5 | 43 | 35 | 77 | 7.6 | 3.44 | 9.6 | 84.6 | 6441 | 24.4 | 43.7 | 14.3 | 43 | 38 | 206 | 55 | 1071.29 | 1047.71 | VALIDATE |
| 6 | 6 | 53 | 45 | 80 | 7.7 | 3.45 | 10.2 | 66.8 | 3325 | 38.5 | 43.1 | 25.5 | 30 | 32 | 72 | 54 | 1030.38 | 1062.56 | TRAIN |
| 7 | 7 | 43 | 30 | 74 | 10.9 | 3.23 | 12.1 | 83.9 | 4679 | 3.5 | 49.2 | 11.3 | 21 | 32 | 62 | 56 | 934.70 | 934.70 | TRAIN |
| 8 | 8 | 45 | 30 | 73 | 9.3 | 3.29 | 10.6 | 86.0 | 2140 | 5.3 | 40.4 | 10.5 | 6 | 4 | 4 | 56 | 899.53 | 900.48 | TRAIN |
| 9 | 9 | 36 | 24 | 70 | 9.0 | 3.31 | 10.5 | 83.2 | 6582 | 8.1 | 42.5 | 12.6 | 18 | 12 | 37 | 61 | 1001.90 | 971.06 | TRAIN |
| 10 | 10 | 36 | 27 | 72 | 9.5 | 3.36 | 10.7 | 79.3 | 4213 | 6.7 | 41.0 | 13.2 | 12 | 7 | 20 | 59 | 912.35 | 927.10 | VALIDATE |