The ICPHREG Procedure

This example illustrates how to plot the predicted survival and cumulative hazard functions for specified covariate patterns.
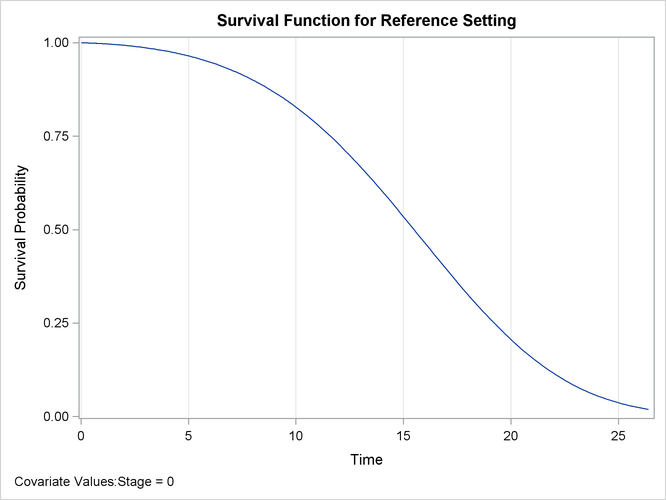
The following statements request a plot of the estimated baseline survival function:
ods graphics on;
proc icphreg data=hiv plot=surv;
   class Stage / desc;
   model (Left, Right) = Stage / basehaz=splines;
run;
Output 51.2.1 shows the predicted survival curve at the reference level.
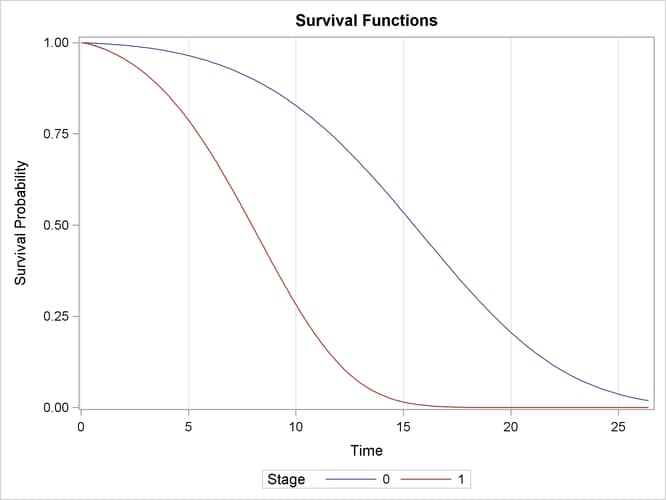
To produce curves for general covariate patterns, you can specify the COVARIATES= option in the BASELINE statement. The following
statements create observations for two levels of Stage and plot the corresponding predicted curves:
data cov;
   Stage=0; output;
   Stage=1; output;
run;

proc icphreg data=hiv plot=surv;
   class Stage / desc;
   model (Left, Right) = Stage / basehaz=splines;
   baseline covariates=cov;
run;
Under the proportional hazards assumption, the two curves do not cross each other. As shown in Output 51.2.2, patients at Stage 1 have much lower survival rates than patients at Stage 0.
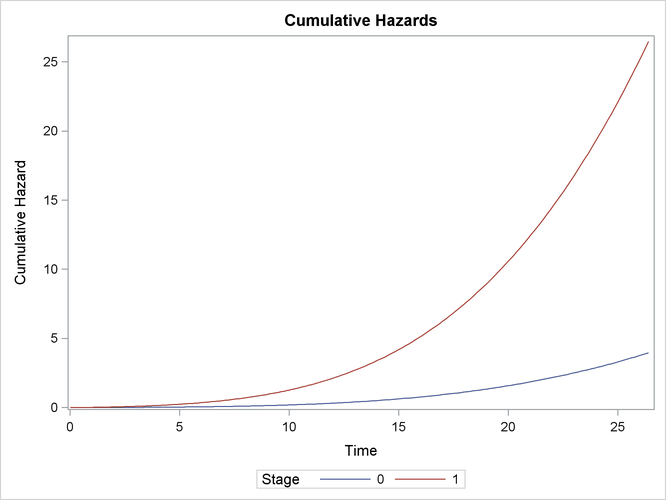
The following statements request a plot of the predicted cumulative hazard functions for the two levels of Stage:
proc icphreg data=hiv plot=cumhaz;
   class Stage / desc;
   model (Left, Right) = Stage / basehaz=splines;
   baseline covariates=cov;
run;
Output 51.2.3 shows the plot.