The CORRESP Procedure

Data are available containing the numbers of Ph.D.’s awarded in the United States during the years 1973 through 1978 (U.S. Bureau of the Census, 1979). The table has six rows, one for each of six academic disciplines, and six columns for the six years.
The following DATA step reads the complete table into a SAS data set, and PROC CORRESP displays correspondence analysis results including the inertia decomposition and coordinates:
title "Number of Ph.D.'s Awarded from 1973 to 1978";

data PhD;
   input Science $ 1-19 y1973-y1978;
   label y1973 = '1973'
         y1974 = '1974'
         y1975 = '1975'
         y1976 = '1976'
         y1977 = '1977'
         y1978 = '1978';
   datalines;
Life Sciences       4489 4303 4402 4350 4266 4361
Physical Sciences   4101 3800 3749 3572 3410 3234
Social Sciences     3354 3286 3344 3278 3137 3008
Behavioral Sciences 2444 2587 2749 2878 2960 3049
Engineering         3338 3144 2959 2791 2641 2432
Mathematics         1222 1196 1149 1003  959  959
;
ods graphics on;

proc corresp data=PhD out=Results short chi2p;
   var y1973-y1978;
   id Science;
run;
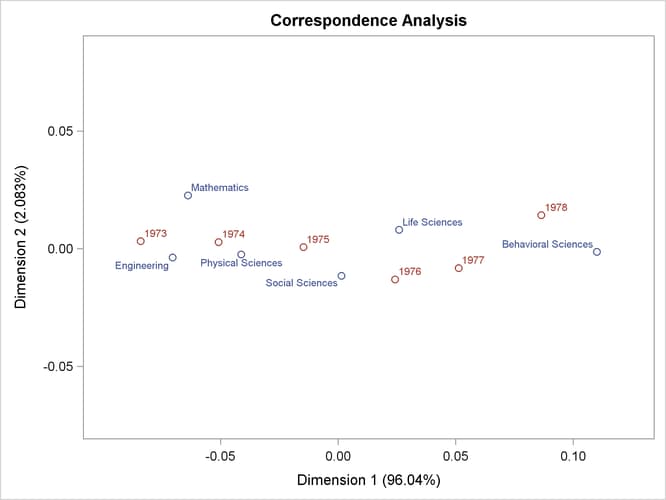
The results are displayed in Figure 34.1 and Figure 34.2.
Figure 34.1: Inertia and Chi-Square Decomposition
| Number of Ph.D.'s Awarded from 1973 to 1978 |
| Inertia and Chi-Square Decomposition | |||||
|---|---|---|---|---|---|
| Singular Value |
Principal Inertia |
Chi- Square |
Percent |
Cumulative Percent |
19 38 57 76 95 ----+----+----+----+----+--- |
| 0.05845 | 0.00342 | 368.653 | 96.04 | 96.04 | ************************* |
| 0.00861 | 0.00007 | 7.995 | 2.08 | 98.12 | * |
| 0.00694 | 0.00005 | 5.197 | 1.35 | 99.48 | |
| 0.00414 | 0.00002 | 1.852 | 0.48 | 99.96 | |
| 0.00122 | 0.00000 | 0.160 | 0.04 | 100.00 | |
| Total | 0.00356 | 383.856 | 100.00 | ||
| Degrees of Freedom = 25 | |||||
| Pr > ChiSq < .0001 | |||||
The concept of inertia in correspondence analysis is analogous to the concept of variance in principal component analysis, and it is proportional to the chi-square information.
In Figure 34.1, the total chi-square statistic, which is a measure of the association between the rows and columns in the full five dimensions of the (centered) table, is 383.856. The chi-square p-value, < 0.001, is displayed when you specify the CHI2P option. The maximum number of dimensions (or axes) is the minimum of the number of rows and columns, minus one. More than 96% of the total chi-square and inertia is explained by the first dimension, indicating that the association between the row and column categories is essentially one-dimensional. The plot in Figure 34.2 shows how the number of doctorates in the different disciplines changes over time. The plot shows that the number of doctorates in the behavioral sciences is associated with later years, and the number of doctorates in mathematics and engineering is associated with earlier years. This is consistent with the data that show that the number of doctorates in the behavioral sciences is increasing, the number of doctorates in every other discipline is decreasing, and the rate of decrease is greatest for mathematics and engineering.