The TRANSREG Procedure
- Overview
-
Getting Started

-
Syntax

-
Details
 Model Statement UsageBox-Cox TransformationsUsing Splines and KnotsScoring Spline VariablesLinear and Nonlinear Regression FunctionsSimultaneously Fitting Two Regression FunctionsPenalized B-SplinesSmoothing SplinesSmoothing Splines Changes and EnhancementsIteration History Changes and EnhancementsANOVA CodingsMissing ValuesMissing Values, UNTIE, and Hypothesis TestsControlling the Number of IterationsUsing the REITERATE Algorithm OptionAvoiding Constant TransformationsConstant VariablesCharacter OPSCORE VariablesConvergence and DegeneraciesImplicit and Explicit InterceptsPassive ObservationsPoint ModelsRedundancy AnalysisOptimal ScalingOPSCORE, MONOTONE, UNTIE, and LINEAR TransformationsSPLINE and MSPLINE TransformationsSpecifying the Number of KnotsSPLINE, BSPLINE, and PSPLINE ComparisonsHypothesis TestsOutput Data SetOUTTEST= Output Data SetComputational ResourcesUnbalanced ANOVA without CLASS VariablesHypothesis Tests for Simple Univariate ModelsHypothesis Tests with Monotonicity ConstraintsHypothesis Tests with Dependent Variable TransformationsHypothesis Tests with One-Way ANOVAUsing the DESIGN Output OptionDiscrete Choice Experiments: DESIGN, NORESTORE, NOZEROCenteringDisplayed OutputODS Table NamesODS Graphics
 -
Examples

- References
You can use PROC TRANSREG to plot and output to a SAS data set the same smoothing spline function that the GPLOT procedure
creates. You request a smoothing spline transformation by specifying SMOOTH in the MODEL statement. The smoothing parameter can be specified with either the SM= or the PARAMETER= o-option. The results are saved in the independent variable transformation (for example, Tx, when the independent variable is x) and the predicted values variable (for example, Py, when the dependent variable is y).
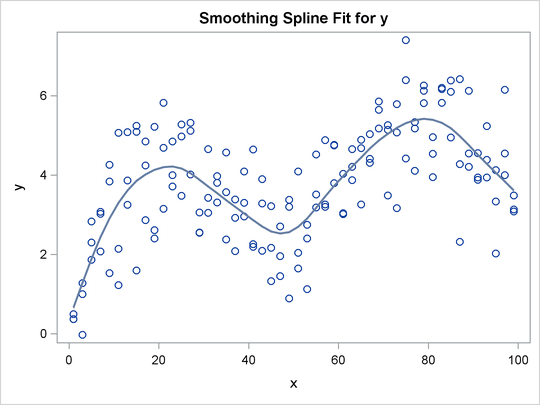
You can display the smoothing spline by using PROC TRANSREG and ODS Graphics (as shown in Figure 97.41). The following statements produce Figure 97.41:
title h=1.5 'Smoothing Splines';

ods graphics on;

data x;
   do x = 1 to 100 by 2;
      do rep = 1 to 3;
         y = log(x) + sin(x / 10) + normal(7);
         output;
      end;
   end;
run;

proc transreg;
   model identity(y) = smooth(x / sm=50);
   output p;
run;
You can also use PROC GPLOT to verify that the two procedures produce the same results. The PROC GPLOT plot request y * x = 1 displays the data as stars. The specification y * x = 2 with I=SM50 requests the smooth curve through the scatter plot. It is overlaid with Py * x = 3, which displays with large dots the smooth function created by PROC TRANSREG. The results of the following step are not displayed:
proc gplot;
   axis1 minor=none label=(angle=90 rotate=0);
   axis2 minor=none;
   symbol1 color=blue v=circle i=none;  /* data              */
   symbol2 color=blue v=none   i=sm50;  /* gplot's smooth    */
   symbol3 color=red  v=dot    i=none;  /* transreg's smooth */
   plot y*x=1 y*x=2 py*x=3 / overlay haxis=axis2 vaxis=axis1 frame;
run; quit;
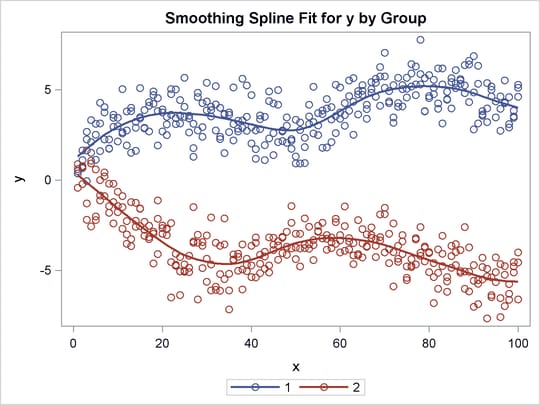
You can plot multiple nonlinear functions, one for each of several groups as defined by the levels of a CLASS variable. When you cross a SMOOTH variable with a CLASS variable, specify ZERO=NONE with the CLASS expansion. The following statements create artificial data and produce Figure 97.42:
title2 'Two Groups';

data x;
   do x = 1 to 100;
      Group = 1;
      do rep = 1 to 3;
         y = log(x) + sin(x / 10) + normal(7);
         output;
      end;
      group = 2;
      do rep = 1 to 3;
         y = -log(x) + cos(x / 10) + normal(7);
         output;
      end;
   end;
run;

proc transreg ss2 data=x;
   model identity(y) = class(group / zero=none) *
                       smooth(x / sm=50);
   output p;
run;
The ANOVA table in Figure 97.42 shows the overall model fit. The degrees of freedom are based on the trace of the transformation hat matrix, and are typically not integers. The “Smooth Transformation” table reports the degrees of freedom for each term, which includes an intercept for each group; the regression coefficients, which are always 1 with smoothing splines; the 0 to 100 smoothing parameter (like the one PROC GPLOT uses); the actual computed smoothing parameter; and the name and label for each term.
Figure 97.42: Smoothing Spline Example 2
| Smoothing Splines |
| Two Groups |
| Class Level Information | ||
|---|---|---|
| Class | Levels | Values |
| Group | 2 | 1 2 |
| Number of Observations Read | 600 |
|---|---|
| Number of Observations Used | 600 |
| Implicit Intercept Model |
| Univariate ANOVA Table, Smooth Transformation | |||||
|---|---|---|---|---|---|
| Source | DF | Sum of Squares | Mean Square | F Value | Pr > F |
| Model | 16.794 | 9195.493 | 547.5365 | 562.03 | <.0001 |
| Error | 582.21 | 567.195 | 0.9742 | ||
| Corrected Total | 599 | 9762.688 | |||
| Root MSE | 0.98702 | R-Square | 0.9419 |
|---|---|---|---|
| Dependent Mean | 0.03651 | Adj R-Sq | 0.9402 |
| Coeff Var | 2703.13908 |
| Smooth Transformation | |||||
|---|---|---|---|---|---|
| Variable | DF | Coefficient | SM | Parameter | Label |
| Smooth(Group1x) | 8.8971 | 1.000 | 50 | 2405.265 | Group 1 * x |
| Smooth(Group2x) | 8.8971 | 1.000 | 50 | 2405.265 | Group 2 * x |

The SMOOTH transformation is valid only with independent variables. Typically, it is used only, as in the two preceding examples, in models with a single dependent variable, a single independent variable, and optionally, a single classification variable that is crossed with the independent variable. The various standardization options such as TSTANDARD=, CENTER, Z, and REFLECT are by default not permitted when the SMOOTH transformation is part of the model.
The SMOOTH transformation can also be used in other ways, but only when you specify the NSR a-option. (See the section Smoothing Splines Changes and Enhancements.) When you specify the NSR a-option, and there are multiple independent variables designated as SMOOTH, PROC TRANSREG tries to smooth the ith independent variable by using the ith dependent variable as a target. When there are more independent variables than dependent variables, the last dependent variable is reused as often as is necessary. For example, consider the following statements:
proc transreg nsr;
   model identity(y1-y3) = smooth(x1-x5);
run;
Smoothing is based on the pairs (y1, x1), (y2, x2), (y3, x3), (y3, x4), and (y3, x5).
The SMOOTH transformation is a noniterative transformation. The smoothing of each variable occurs before the iterations begin. In contrast, SSPLINE provides an iterative smoothing spline transformation. It does not generally minimize squared error; hence, divergence is possible with SSPLINE.
