The TREE Procedure

Example 98.1 Mammals’ Teeth
The following statements produce a data set that contains the numbers of different kinds of teeth for a variety of mammals:
data teeth;
   title 'Mammals'' Teeth';
   input mammal & $16. v1-v8 @@;
   label v1='Right Top Incisors'
         v2='Right Bottom Incisors'
         v3='Right Top Canines'
         v4='Right Bottom Canines'
         v5='Right Top Premolars'
         v6='Right Bottom Premolars'
         v7='Right Top Molars'
         v8='Right Bottom Molars';
   datalines;
Brown Bat         2 3 1 1 3 3 3 3   Mole              3 2 1 0 3 3 3 3
Silver Hair Bat   2 3 1 1 2 3 3 3   Pigmy Bat         2 3 1 1 2 2 3 3
House Bat         2 3 1 1 1 2 3 3   Red Bat           1 3 1 1 2 2 3 3
Pika              2 1 0 0 2 2 3 3   Rabbit            2 1 0 0 3 2 3 3
Beaver            1 1 0 0 2 1 3 3   Groundhog         1 1 0 0 2 1 3 3
Gray Squirrel     1 1 0 0 1 1 3 3   House Mouse       1 1 0 0 0 0 3 3
Porcupine         1 1 0 0 1 1 3 3   Wolf              3 3 1 1 4 4 2 3
Bear              3 3 1 1 4 4 2 3   Raccoon           3 3 1 1 4 4 3 2
Marten            3 3 1 1 4 4 1 2   Weasel            3 3 1 1 3 3 1 2
Wolverine         3 3 1 1 4 4 1 2   Badger            3 3 1 1 3 3 1 2
River Otter       3 3 1 1 4 3 1 2   Sea Otter         3 2 1 1 3 3 1 2
Jaguar            3 3 1 1 3 2 1 1   Cougar            3 3 1 1 3 2 1 1
Fur Seal          3 2 1 1 4 4 1 1   Sea Lion          3 2 1 1 4 4 1 1
Grey Seal         3 2 1 1 3 3 2 2   Elephant Seal     2 1 1 1 4 4 1 1
Reindeer          0 4 1 0 3 3 3 3   Elk               0 4 1 0 3 3 3 3
Deer              0 4 0 0 3 3 3 3   Moose             0 4 0 0 3 3 3 3
;
The following statements use the CLUSTER procedure to cluster the mammals by average linkage and use ODS Graphics and the TREE procedure to produce a horizontal tree diagram that uses the average-linkage distance as its height axis:
ods graphics on;

proc cluster method=average std pseudo noeigen outtree=tree;
   id mammal;
   var v1-v8;
run;
proc tree horizontal;
run;
Output 98.1.1 displays the information about how the clusters are joined. For example, the cluster history shows that the mammals 'Wolf' and 'Bear' form cluster 29, which is merged with 'Raccoon' to form cluster 11.
Output 98.1.1: Output from PROC CLUSTER
| Mammals' Teeth |
| Root-Mean-Square Total-Sample Standard Deviation | 1 |
|---|
| Root-Mean-Square Distance Between Observations | 4 |
|---|
| Cluster History | |||||||
|---|---|---|---|---|---|---|---|
| Number of Clusters |
Clusters Joined | Freq | Pseudo F Statistic |
Pseudo t-Squared |
Norm RMS Distance |
Tie | |
| 31 | Beaver | Groundhog | 2 | . | . | 0 | T |
| 30 | Gray Squirrel | Porcupine | 2 | . | . | 0 | T |
| 29 | Wolf | Bear | 2 | . | . | 0 | T |
| 28 | Marten | Wolverine | 2 | . | . | 0 | T |
| 27 | Weasel | Badger | 2 | . | . | 0 | T |
| 26 | Jaguar | Cougar | 2 | . | . | 0 | T |
| 25 | Fur Seal | Sea Lion | 2 | . | . | 0 | T |
| 24 | Reindeer | Elk | 2 | . | . | 0 | T |
| 23 | Deer | Moose | 2 | . | . | 0 | |
| 22 | Pigmy Bat | Red Bat | 2 | 281 | . | 0.2289 | |
| 21 | CL28 | River Otter | 3 | 139 | . | 0.2292 | |
| 20 | CL31 | CL30 | 4 | 83.2 | . | 0.2357 | T |
| 19 | Brown Bat | Silver Hair Bat | 2 | 76.7 | . | 0.2357 | T |
| 18 | Pika | Rabbit | 2 | 73.2 | . | 0.2357 | |
| 17 | CL27 | Sea Otter | 3 | 67.4 | . | 0.2462 | |
| 16 | CL22 | House Bat | 3 | 62.9 | 1.7 | 0.2859 | |
| 15 | CL21 | CL17 | 6 | 47.4 | 6.8 | 0.3328 | |
| 14 | CL25 | Elephant Seal | 3 | 45.0 | . | 0.3362 | |
| 13 | CL19 | CL16 | 5 | 40.8 | 3.5 | 0.3672 | |
| 12 | CL15 | Grey Seal | 7 | 38.9 | 2.8 | 0.4078 | |
| 11 | CL29 | Raccoon | 3 | 38.0 | . | 0.423 | |
| 10 | CL18 | CL20 | 6 | 34.5 | 10.3 | 0.4339 | |
| 9 | CL12 | CL26 | 9 | 30.0 | 7.3 | 0.5071 | |
| 8 | CL24 | CL23 | 4 | 28.7 | . | 0.5473 | |
| 7 | CL9 | CL14 | 12 | 25.7 | 7.0 | 0.5668 | |
| 6 | CL10 | House Mouse | 7 | 28.3 | 4.1 | 0.5792 | |
| 5 | CL11 | CL7 | 15 | 26.8 | 6.9 | 0.6621 | |
| 4 | CL13 | Mole | 6 | 31.9 | 7.2 | 0.7156 | |
| 3 | CL4 | CL8 | 10 | 31.0 | 12.7 | 0.8799 | |
| 2 | CL3 | CL6 | 17 | 27.8 | 16.1 | 1.0316 | |
| 1 | CL2 | CL5 | 32 | . | 27.8 | 1.1938 | |
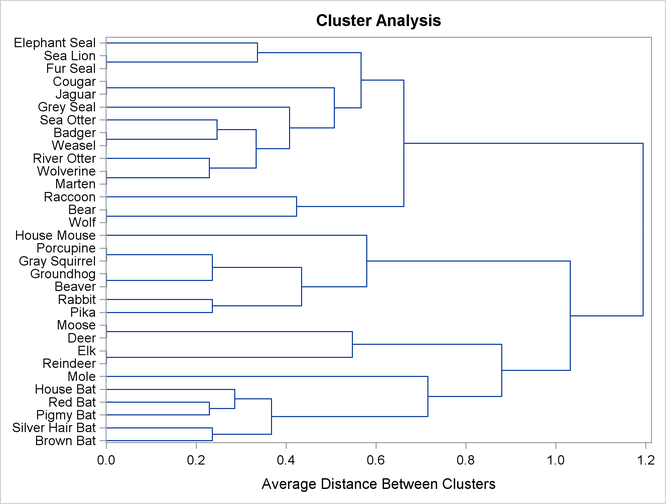
Output 98.1.2 shows the tree diagram produced by PROC CLUSTER.
Output 98.1.2: Dendrogram from PROC CLUSTER
Output 98.1.3 shows the corresponding tree diagram produced by PROC TREE.
Output 98.1.3: Tree Diagram of Mammal Teeth Clusters
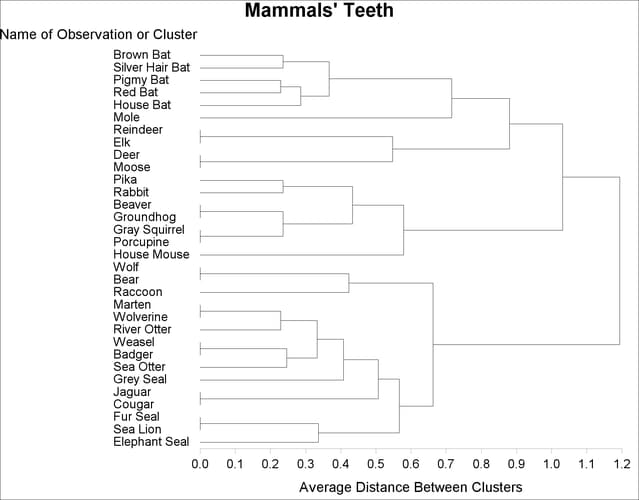
As you view the diagram in Output 98.1.3 from left to right, objects and clusters are progressively joined until a single, all-encompassing cluster is formed at the right (or root) of the tree. Clusters exist at each level of the diagram, and every vertical line connects leaves and branches into progressively larger clusters. For example, the five bats form a cluster at the 0.6 level, while the next cluster consists only of the mole. The mammals 'Reindeer', 'Elk', 'Deer', and 'Moose' form the next cluster at the 0.6 level, the mammals 'Pika' through 'House Mouse' are in the fourth cluster, the mammals 'Wolf', 'Bear', and 'Raccoon' form the fifth cluster, and the last cluster contains the mammals 'Marten' through 'Elephant Seal'.
The following statements create the same tree with line printer graphics in a vertical orientation:
proc tree lineprinter;
run;
The tree is displayed in Output 98.1.4.
Output 98.1.4: PROC TREE with the LINEPRINTER Option
| Mammals' Teeth |
                            Name of Observation or Cluster

              S
              i
              l                         G                                 E
              v                         r                                 l
              e                         a   H           R                 e
              r                         y   o           i                 p
            B   P   H                 G   P u         W v     S G         h
            r H i   o   R             r S o s         o e     e r     F S a
            o a g R u   e             o q r e     R   l r     a e     u e n
            w i m e s   i         R B u u c       a M v   W B   y J C r a t
            n r y d e   n     M   a e n i u M     c a e O e a O   a o
                      M d   D o P b a d r p o W B c r r t a d t S g u S L S
            B B B B B o e E e o i b v h r i u o e o t i t s g t e u g e i e
            a a a a a l e l e s k i e o e n s l a o e n e e e e a a a a o a
            t t t t t e r k r e a t r g l e e f r n n e r l r r l r r l n l
    A  1.5 +
    v      |
    e      |
    r      |XXXXXXXXXXXXXXXXXXXXXXXXXXXXXXXXXXXXXXXXXXXXXXXXXXXXXXXXXXXXXXX
    a      |XXXXXXXXXXXXXXXXXXXXXXXXXXXXXXXXX XXXXXXXXXXXXXXXXXXXXXXXXXXXXX
    g    1 +XXXXXXXXXXXXXXXXXXXXXXXXXXXXXXXXX XXXXXXXXXXXXXXXXXXXXXXXXXXXXX
    e      |XXXXXXXXXXXXXXXXXXX XXXXXXXXXXXXX XXXXXXXXXXXXXXXXXXXXXXXXXXXXX
           |XXXXXXXXXXX XXXXXXX XXXXXXXXXXXXX XXXXXXXXXXXXXXXXXXXXXXXXXXXXX
    D      |XXXXXXXXXXX XXXXXXX XXXXXXXXXXXXX XXXXXXXXXXXXXXXXXXXXXXXXXXXXX
    i      |XXXXXXXXX . XXXXXXX XXXXXXXXXXXXX XXXXX XXXXXXXXXXXXXXXXXXXXXXX
    s  0.5 +XXXXXXXXX . XXXXXXX XXXXXXXXXXX . XXXXX XXXXXXXXXXXXXXXXX XXXXX
    t      |XXXXXXXXX . XXX XXX XXXXXXXXXXX . XXXXX XXXXXXXXXXXXX XXX XXXXX
    a      |XXX XXXXX . XXX XXX XXX XXXXXXX . XXX . XXXXXXXXXXX . XXX XXXXX
    n      |XXX XXX . . XXX XXX XXX XXXXXXX . XXX . XXXXX XXXXX . XXX XXX .
    c      |. . . . . . XXX XXX . . XXX XXX . XXX . XXX . XXX . . XXX XXX .
    e    0 +. . . . . . XXX XXX . . XXX XXX . XXX . XXX . XXX . . XXX XXX .

    B
|
As you look up from the bottom of the diagram, objects and clusters are progressively joined until a single, all-encompassing cluster is formed at the top (or root) of the root. Clusters exist at each level of the diagram. For example, the unbroken line of Xs at the leftmost side of the 0.6 level indicates that the five bats have formed a cluster. The next cluster is represented by a period because it contains only one mammal, 'Mole'. The mammals 'Reindeer', 'Elk', 'Deer', and 'Moose' form the next cluster, indicated by Xs again. The mammals 'Pika' through 'House Mouse' are in the fourth cluster. The mammals 'Wolf', 'Bear', and 'Raccoon' form the fifth cluster, while the last cluster contains the mammals 'Marten' through 'Elephant Seal'.
The next statements sort the clusters at each branch in order of formation and use the number of clusters as the height axis:
proc tree sort height=n horizontal;
run;
The resulting tree is displayed in Output 98.1.5.
Output 98.1.5: PROC TREE with SORT and HEIGHT= Options
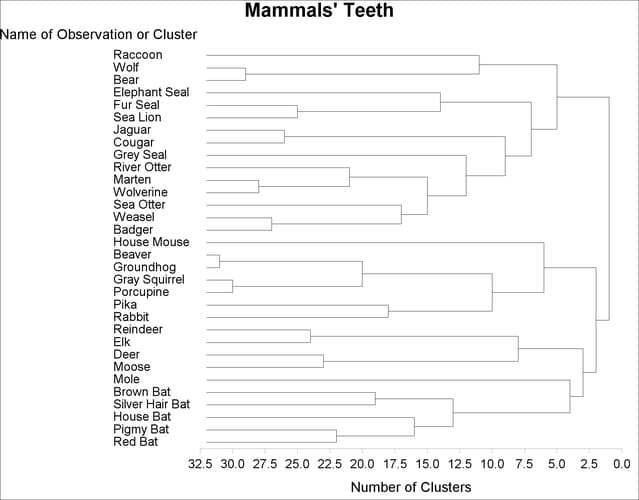
Because the CLUSTER procedure always produces binary trees, the number of internal (root and branch) nodes in the tree is one less than the number of leaves. Therefore 31 clusters are formed from the 32 mammals in the input data set. These are represented by the 31 vertical line segments in the tree diagram, each at a different value along the horizontal axis.
As you examine the tree from left to right, the first vertical line segment is where 'Beaver' and 'Groundhog' are clustered and the number of clusters is 31. The next cluster is formed from 'Gray Squirrel' and 'Porcupine'. The third contains 'Wolf' and 'Bear'. Note how the tree graphically displays the clustering order information that was presented in tabular form by the CLUSTER procedure in Output 98.1.1.
The same clusters as in Output 98.1.3 and Output 98.1.4 can be seen at the six-cluster level of the tree diagram in Output 98.1.5, although the SORT and HEIGHT= options make them appear in a different order.
The following statements create these six clusters and save the result in the output data set part:
proc tree noprint out=part nclusters=6;
   id mammal;
   copy v1-v8;
run;

proc sort;
   by cluster;
run;
PROC TREE with the NOPRINT option displays no output but creates an output data set that indicates the cluster to which each
observation belongs at the six-cluster level in the tree. The following statements print the data set part, with the results shown in Output 98.1.6:
proc print label uniform;
   id mammal;
   var v1-v8;
   format v1-v8 1.;
   by cluster;
run;
Output 98.1.6: PROC TREE OUT= Data Set
| Mammals' Teeth |
| mammal | Right Top Incisors |
Right Bottom Incisors |
Right Top Canines |
Right Bottom Canines |
Right Top Premolars |
Right Bottom Premolars |
Right Top Molars |
Right Bottom Molars |
|---|---|---|---|---|---|---|---|---|
| Beaver | 1 | 1 | 0 | 0 | 2 | 1 | 3 | 3 |
| Groundhog | 1 | 1 | 0 | 0 | 2 | 1 | 3 | 3 |
| Gray Squirrel | 1 | 1 | 0 | 0 | 1 | 1 | 3 | 3 |
| Porcupine | 1 | 1 | 0 | 0 | 1 | 1 | 3 | 3 |
| Pika | 2 | 1 | 0 | 0 | 2 | 2 | 3 | 3 |
| Rabbit | 2 | 1 | 0 | 0 | 3 | 2 | 3 | 3 |
| House Mouse | 1 | 1 | 0 | 0 | 0 | 0 | 3 | 3 |
| mammal | Right Top Incisors |
Right Bottom Incisors |
Right Top Canines |
Right Bottom Canines |
Right Top Premolars |
Right Bottom Premolars |
Right Top Molars |
Right Bottom Molars |
|---|---|---|---|---|---|---|---|---|
| Wolf | 3 | 3 | 1 | 1 | 4 | 4 | 2 | 3 |
| Bear | 3 | 3 | 1 | 1 | 4 | 4 | 2 | 3 |
| Raccoon | 3 | 3 | 1 | 1 | 4 | 4 | 3 | 2 |
| mammal | Right Top Incisors |
Right Bottom Incisors |
Right Top Canines |
Right Bottom Canines |
Right Top Premolars |
Right Bottom Premolars |
Right Top Molars |
Right Bottom Molars |
|---|---|---|---|---|---|---|---|---|
| Marten | 3 | 3 | 1 | 1 | 4 | 4 | 1 | 2 |
| Wolverine | 3 | 3 | 1 | 1 | 4 | 4 | 1 | 2 |
| Weasel | 3 | 3 | 1 | 1 | 3 | 3 | 1 | 2 |
| Badger | 3 | 3 | 1 | 1 | 3 | 3 | 1 | 2 |
| Jaguar | 3 | 3 | 1 | 1 | 3 | 2 | 1 | 1 |
| Cougar | 3 | 3 | 1 | 1 | 3 | 2 | 1 | 1 |
| Fur Seal | 3 | 2 | 1 | 1 | 4 | 4 | 1 | 1 |
| Sea Lion | 3 | 2 | 1 | 1 | 4 | 4 | 1 | 1 |
| River Otter | 3 | 3 | 1 | 1 | 4 | 3 | 1 | 2 |
| Sea Otter | 3 | 2 | 1 | 1 | 3 | 3 | 1 | 2 |
| Elephant Seal | 2 | 1 | 1 | 1 | 4 | 4 | 1 | 1 |
| Grey Seal | 3 | 2 | 1 | 1 | 3 | 3 | 2 | 2 |
| mammal | Right Top Incisors |
Right Bottom Incisors |
Right Top Canines |
Right Bottom Canines |
Right Top Premolars |
Right Bottom Premolars |
Right Top Molars |
Right Bottom Molars |
|---|---|---|---|---|---|---|---|---|
| Reindeer | 0 | 4 | 1 | 0 | 3 | 3 | 3 | 3 |
| Elk | 0 | 4 | 1 | 0 | 3 | 3 | 3 | 3 |
| Deer | 0 | 4 | 0 | 0 | 3 | 3 | 3 | 3 |
| Moose | 0 | 4 | 0 | 0 | 3 | 3 | 3 | 3 |
| mammal | Right Top Incisors |
Right Bottom Incisors |
Right Top Canines |
Right Bottom Canines |
Right Top Premolars |
Right Bottom Premolars |
Right Top Molars |
Right Bottom Molars |
|---|---|---|---|---|---|---|---|---|
| Pigmy Bat | 2 | 3 | 1 | 1 | 2 | 2 | 3 | 3 |
| Red Bat | 1 | 3 | 1 | 1 | 2 | 2 | 3 | 3 |
| Brown Bat | 2 | 3 | 1 | 1 | 3 | 3 | 3 | 3 |
| Silver Hair Bat | 2 | 3 | 1 | 1 | 2 | 3 | 3 | 3 |
| House Bat | 2 | 3 | 1 | 1 | 1 | 2 | 3 | 3 |
| mammal | Right Top Incisors |
Right Bottom Incisors |
Right Top Canines |
Right Bottom Canines |
Right Top Premolars |
Right Bottom Premolars |
Right Top Molars |
Right Bottom Molars |
|---|---|---|---|---|---|---|---|---|
| Mole | 3 | 2 | 1 | 0 | 3 | 3 | 3 | 3 |