| The SGPLOT Procedure |
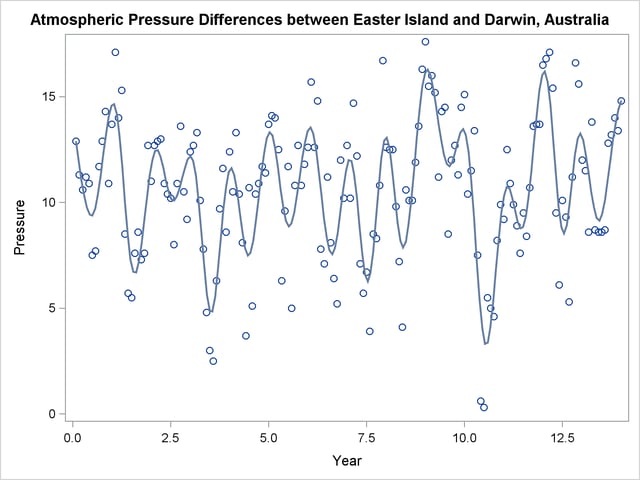
PROC SGPLOT provides a simple way to make a variety of scatter plots. This example is taken from Example 52.4 of Chapter 52, The LOESS Procedure. The ENSO data set, which contains information about differences in ocean pressure over time, is available from the Sashelp library.
The following statements create a scatter plot of points along with a penalized B-spline fit to the data and produce Figure 21.55:
proc sgplot data=sashelp.enso noautolegend;
   title 'Atmospheric Pressure Differences between '
         'Easter Island and Darwin, Australia';
   pbspline y=pressure x=year;
run;
Figure 21.55
Penalized B-Spline Fit with PROC SGPLOT
See Chapter 93, The TRANSREG Procedure, for more information about penalized B-splines. Also see the section Grouped Scatter Plot with PROC SGPLOT and Figure 21.12 for an example of a scatter plot with groups of observations.