| Grouped Scatter Plot with PROC SGPLOT |
This example is taken from Example 32.1 of Chapter 32, The DISCRIM Procedure. It uses the Fisher iris data set, which is available from the Sashelp library.
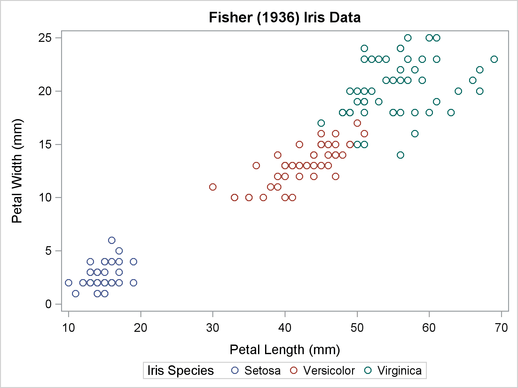
The following statements run PROC SGPLOT to make a scatter plot, grouped by iris species:
proc sgplot data=sashelp.iris;
   title 'Fisher (1936) Iris Data';
   scatter x=petallength y=petalwidth / group=species;
run;
The results are shown in Figure 21.12.
Figure 21.12
Iris Data
See the section Statistical Graphics Procedures and the SAS ODS Graphics: Procedures Guide for more information about PROC SGPLOT (statistical graphics plot) and other SG procedures. You do not need to enable ODS Graphics in order to use SG procedures (because making plots with ODS Graphics is their sole function).